Wednesday, September 29, 2010

Headway harmonisation hits the news

Today's Age carries an article making the point that no one is in charge of Melbourne's public transport, especially when it comes to service co-ordination.

It contained several quotes on who is responsible for service co-ordination. The confusion evident only demonstrated that different parties have different ideas of what this means.

The calls for a transport planning agency have largely come about due to the gap between the integration that passengers see in fares and information and the disintegration experienced when timetables do not connect, nor are even planned to connect.

Although the Altona example given in the Age article was not a good one, the point made about the non-harmonisation of bus with train timetables is easily able to be tested.

Earlier this year I checked timetable harmonisation at selected bus/train interchanges in Melbourne and Perth.

The method for assessing harmonisation was as follows:

* If the train ran every 20 minutes and buses ran every 20, 40 or 60 minutes, this was counted as harmonised. However if the bus was every 15, 38 or 55 minutes this was not considered harmonised.

* Public holiday arrangements for buses can vary. Tthe figure given is the percentage that follow train holiday patterns (eg if train runs to a Saturday timetable the bus does as well).

* Routes planned as a combined service (eg 216/219 or 827/828) were counted as one.

* Only daytime off-peak services were examined.

* Of course the above does not guarantee connectivity; a bus every 15 minutes could consistently miss a train every 15 minutes by 14 minutes. However unless services are very frequent headway harmonisation is a pre-requisite for high connectivity. And if frequencies are harmonised it should be easier to optimise times for connectivity at the busiest locations.

The extent of bus/train headway harmonisation was found to be as follows:

Percentage of bus routes harmonised with trains by interchange (Mon-Fri/Sat/Sun/Pub Hol)

Perth - Bassendean: 67/33/100/100
Perth - Canning Bridge: 80/100/100/100
Perth - Murdoch: 100/100/100/100
Perth - Whitfords: 100/100/100/100

Melbourne - Cheltenham: 75/75/75/75
Melbourne - Clayton: 80/33/67/100
Melbourne - Craigieburn: 0/0/0/100
Melbourne - Cranbourne: 43/50/50/80
Melbourne - Dandenong: 78/86/80/56
Melbourne - Frankston: 64/67/70/77
Melbourne - Hoppers Crossing: 100/100/100/80
Melbourne - Huntingdale: 75/0/50/100
Melbourne - Pakenham: 100/0/0/80
Melbourne - Reservoir: 17/17/25/67
Melbourne - Sunshine: 30/20/40/80
Melbourne - Watergardens: 83/83/100/83

The above shows that bus/train frequency harmonisation is almost universal in Perth but variable in Melbourne. Similar comments apply for public holidays, with a network-wide standard existing in Perth but not in Melbourne, where holiday practices vary between bus operators and routes (despite substantial recent progress). Both reinforce public impressions of bus routes as complex and unreliable, contrary to the Minister's recent call to embrace bus travel.

The ability to achieve widespread connectivity in one city and patchy connectivity in another indicate that although we have authorities clearly responsible for policy and contract management (Department of Transport), ticketing (Transport Ticketing Authority), information and marketing (Metlink), the equally important function of service planning remains on the outer, despite its centrality to network usability.

My guess is that Stone's paper will conclude along similar lines. While the Age article doesn't mention this, the conference in Canberra is likely to be the Australian Transport Research Forum. If previous years are any guide, the paper presented today should later become available through the ATRF paper archive which is well worth a read for anyone with a transport interest.

Monday, September 27, 2010

Three new routes

Like yesterday, today was a significant day for Melbourne buses, with three new routes commencing in Melbourne's south-eastern suburbs.

625 and 626

The first two, 625 and 626, are the successors to Route 627. This was considered by some to have been Melbourne's most confusing bus route. Passengers often boarded the wrong bus, and the travel time between the termini of this bent hairpin route was slower than walking speed.

Route 627 also operated to the pre-2006 standard for Melbourne buses, ie no service after 6 or 7 pm or on Sundays. In contrast the new routes feature improved directness, an extension to the Sandringham railway line (626) and longer operating hours including Sunday and public holiday service.

Stop at McKinnon Station

Passenger advice - 627 is no more

Brighton terminus

2 - 4 buses/hour apparently contributes more congestion than residents' SUVs

626 at Chadstone

Route 625 approaching Chadstone Shopping Centre

709

709 is an entirely new route. It serves the suburb of Waterways. This is an exclusive 'green wedge' housing development remote from existing suburbia. It has no schools or shops but residents are said to value the area's cleanliness and serenity.

While the eastern part of the suburb was walkable to SmartBus Route 902, the majority of areas were over ten minutes walk from any public transport. Route 709 provides a basic service to Waterways and Epsom estate from Mordialloc Station, operating approximately hourly until 9pm.

Sign at Mordialloc indicating the new route

Gateway to Waterways

Waterways terminus

Sunday, September 26, 2010

The Yellow Orbital's first day

The first trip

Today I was part of a small group who rode the maiden full-length journey of Route 901 Yellow Orbital SmartBus. We took NightRider and Skybus to reach the airport by 0600.

Our aim to catch the first bus at 0630 nearly didn't happen since the bus did not pass the location indicated as its stop by a temporary sign. Luckily one of our group had the foresight to wait elsewhere and could hail the driver who stopped around the corner so the rest could board. This appeared to be an early glitch; subsequent trips were observed by others to use the marked stop.

Not suprisingly we had the bus to ourselves for the first hour or so; it was still too early for most Sunday engagements and many facilities along the way were under construction. Patronage increased greatly on the established Ringwood to Frankston portion, with the section south of Dandenong carrying a fully seated load nearly to Frankston.

The driver paced his speed well and the bus ran to time for the entire route. There was a short recovery time at most timepoints, but this should lessen once patronage builds and extra time due to ticket sales is factored in (travel is free for the first two weeks).

Along the route

Scenery varied between light industrial (most of the route until Epping and around Dandenong), bulky goods retail (around Nunawading) to residential (around Gladstone Park, Epping, Templestowe, Knox and Frankston North). There were also forested and semi-rural pockets around Yan Yean, which by any standard now has an extremely generous bus service for its population density.

Patronage potential

The existing Ringwood - Dandenong - Frankston section of Route 901 is now established as a high patronage section. It's everything a successful bus route should be - a direct line between trip generators of regional and even metropolitan significance.

Though its environment is pedestrian hostile, the sheer size of retail trade (and workforce) along Nunawading's 'Golden mile' along Whitehorse Road should assure reasonable patronage along this section as well.

My guess is that the north-eastern portion of the route won't be so popular; its feeder role to Blackburn Station will be somewhat lessened by the DART routes which will soon offer SmartBus-standard freeway express city services to much of Manningham. It also passes through areas of suburban (but low) population density at Templestowe and rural levels of density around Yan Yean.

South Morang to Epping should be moderately used as a rail feeder, though this task will be performed by Route 571 which will operate until suburban rail reaches South Morang.

There is some industrial jobs between Epping and Roxburgh Park (especially after the Market opens) that should attract some patronage. It is also from Epping (or even Greensborough) that 901 becomes a faster service to the airport than catching a train to the city plus a Skybus.

Route 901 duplicates local routes between Roxburgh Park and Broadmeadows and Route 902 between Broadmeadows and Gladstone Park. Hence in under a year Gladstone Park has gone from having very low to high levels of transit service.

I would expect the airport portion to be extremely successful - provided that the stop is in a handy location (for both travellers and airport workers) and people know about the service. The airport precinct is a huge employment area and the route will be a big lift for the area, which until today had extremely low service levels.

Photos taken on the first trip

Promotional billboard on entrance to the airport

The old stop for the regular routes (478/479/500)

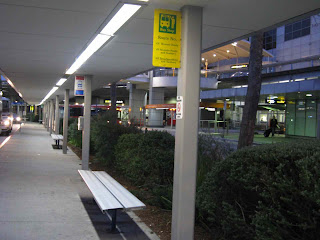
The new (temporary) bus stop sign

Broadmeadows

Roxburgh Park

Greensborough

The Pines Shopping Centre (Doncaster East)

Finishing touches at Blackburn

Arriving Frankston

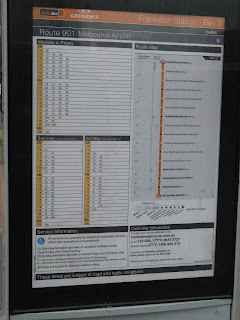
Timetable at Frankston

One passenger who won't be needing a service to the airport

Departing Frankston for Melbourne Airport

A new voice for Metro Trains

The changes are not simply a new voice; there are content alterations as well. 'Trains' are no longer 'trains' but 'services'. The reminder about ticketing has been extended to include Myki.

Voice timbre varies, with the male voice deep and resonant while the female voice is slightly thin and nasally. Enunication is also different and in this listener's mind the timing is less measured. For example the new speaker draws out the 'a' in Frankston but clips (or has clipped) the leading zeroes in departure times.

Saturday, September 25, 2010

Pedestrian strategy and who gets what

Almost unremarked in the mainstream media was the launch of the State Government’s Pedestrian Access Strategy earlier this month. It follows the Cycling strategy released previously.

Rather than explore the strategy, this post will look at how pedestrian resources have been allocated and hence reveal some of the choices and priorities of State Government policy makers to date.

Differing fortunes

Walking and public transport have had different fortunes in the last 30 years.

Metropolitan public transport patronage reached a low point in 1980. Until the early 2000s there were rises and falls, but an overall increase (generally in line with population but insufficient to increase modal share). 2004 – 2009 saw accelerated growth, sufficient to increase transit’s modal share. Preoccupied with rail franchising, refranchising and regional projects, the State Government tapped into this trend quite late but is now providing significant ‘catch-up’ funding for improved bus services and rail infastructure. In the last year train patronage growth has slowed and additional peak services on some lines have relieved crowding though peak punctuality remains too low for reliable connectivity with buses.

Page 18 of the Pedestrian Strategy tells a different story for walking. Its modal share for work commuting more than halved between 1976 and 2001, with only a slight recovery to 2006. This fall is similar in magnitude to the collapse in suburban rail travel during the 1960 – 1980 period.

Just like public transport battled suburbanisation, rising car ownership and limited bus service levels, walking’s enemies have been rising road traffic, poor suburb design, the decline of shopping strips, increased parental protectiveness and the trend to amalgamamated and/or private schooling. And although almost everyone walks, there has been no high-profile organised pedestrian lobby group, such as enjoyed by car drivers, cyclists and public transport users.

Pedestrian funding

If public transport infrastructure spending (and even basic maintenance) can claim to have been the poor cousin to road investment over most of this period, pedestrian access funding is positively destitute.

Page 13 and 14 detail pedestrian access funding over the last ten years. The total spent or earmarked to be spent comes to over $640 million. The distribution of this is as follows:

* $350 million over 10 years to make public transport accessible to people with disabilities. An additional $150 million will be spent on infrastructure to further this.

* 2008 Victorian Transport Plan commitment of $115 million for bicycle lanes and shared bicycle and walking paths (it is not mentioned how much of this has been spent, nor what portion would benefit pedestrians)

* $16 million for the Local Area Access Program (small scale access projects involving local government)

* $5.5 million on TravelSmart (basically marketing walking/cycling/public transport over driving)

* $3.5 million for Vicroads to improve crossings of arterial roads

All public transport trips involve some walking. The ease of reaching a transit stop and vehicle is a critical part of the travel experience, so improving pedestrian access improves the overall service to a wide range of passengers, not just those with impaired mobility. There is a long-standing aim to make our system fully accessible and each passing year sees more low floor buses and tram stops. Investment here accounts for $500 million of our $640 million, or about three-quarters of all claimed pedestrian access spending.

However walking is a transport mode in its own right and the majority of walking trips do not involve a connection to public transport. Its modal share (when measured by number of trips, not trip-kilometres) commonly exceeds that of public transport in many areas, especially for non-work trips.

The amount remaining less public transport accessibility improvements is about $140 million. The lion’s share, or $115 million, went to improvements involving cycling. It is not clear how much of this can be counted as an improvement for pedestrians.

Another 3% of the $640 million, or about $20 million, goes to small-scale access improvements for which pedestrians appear to be the main beneficiary. This includes a $16 million local access program for small-scale local government projects and $3.5 million for improving pedestrian access across major roads, which can divide communities and block safe and direct pedestrian movement.

The potential importance of local projects such as these cannot be underestimated. Most of the Melbourne in 2040 already exists today, and there are thousands of projects such as median strips, traffic calming, signal modifications, roundabout removal and cul-de-sac openings that would boost the walkability of every established suburb.

Although these projects are individually cheap, their sheer number means that $20 million (over several years) doesn’t go very far. Even a twenty fold increase (which would bring the amount involved to that nearer that invested in public transport accessibility) would still represent under 1 percent of Victorian Transport Plan funding and be more consistent with the stated aim of increasing walking’s share.

Finally there is the $5.5 million for TravelSmart funding. This is more properly attributed to several modes including public transport, cycling and even car pooling rather than purely walking. TravelSmart has delivered worthwhile projects such as local access maps (now at city Bike Share racks). However comparing TravelSmart’s allocation with pedestrian access improvements on main roads ($5.5 vs $3.5 million) appears to indicate that telling people that walking is better has a higher priority than making it so, at least on our busier roads.

Priorities

What priorities and biases do these funding patterns indicate?

Disability rights advocates such as Margaret Stevens strenuously argue that the pace of accessability improvements for public transport has been too slow. Melbourne has a particuar problem with its trams as most are older high floor units and many stops are still mid-road ‘safety zones’ that provide for poor access. Funding for accessibility improvements is a minority of total Victorian Transport Plan funding but represents a majority of state government pedestrian funding. Against this it could be considered to be a top priority.

In the middle are various paths, for both cyclists and pedestrians.

At the bottom are local pedestrian access projects, especially where they involve access across main roads.

These funding priorities indicate a welcome tendency to build (or improve) paths but a reluctance to improve access across main roads. A bad path (or none at all) is unattractive to walkers and should be fixed. But at least for the able-bodied it does not seriously reduce end-to-end access speeds (which is the only sound way to measure pedsheds) provided there is some space by the road.

In contrast poor access across main roads results in them forming barriers for much of the day, often barring people of all abilities from reaching bus stops (including some served by low-floor SmartBuses) by the most direct means. Long traffic light cycles similarly compress the ten-minute pedsheds of shopping centres, railway stations and bus stops, reducing the practicality of walking compared to driving.

A pedestrian access audit would find that addressing such pedestrian access deficits on main roads (which in some case may only require an altered traffic light cycle, zebra crossing or new median strip) represent a high priority that should receive a large proportion of project funding.

However the historical reality of funding, according to Pedestrian Strategy figures, is different; just $3.5 million out of $640 million funds went to Vicroads for this purpose.

The Pedestrian Access Strategy is what bureaucrats call a ‘high level’ document with many excellent ideas – if only they were implemented. Its ‘Making it happen’ section describes a governance and consultation process. However it does not give a funding amount nor an indicative works program (eg annual targets for new footpaths, median strips, pedestrian lights, zebra crossings, cul-de-sac joinings and roundabout removals).

Until such a substantive construction program commences, it would appear that Melbourne has a way to go until pedestrians are regarded as legitimate traffic rather than impediments to same, and that road managers can implement goals other than the maximisation of car traffic speed and throughput.

Wednesday, September 22, 2010

How many bus marketing messages can you spot?

(Brighton Buses August 2009 - Dave Spencer and John Bishop)

Tuesday, September 14, 2010

Should train network maps show buses?

Since franchising, on-vehicle public transport information has been mode (and for a while) operator-specific. The old Met-era multimodal inner-city transport maps on trams are now just a distant memory.

Passenger wishing to make connections have to be prepared beforehand, especially if alighting at an unstaffed station. There is often now wayfinding signage at station exits, but rarely bus timetables or current pedestrian-scale maps.

Having to cross a busy road only to find out that the next bus is 30 minutes away discourages interchange and spontaneous bus patronage. Whereas a bus timetable at the station exit would be visible to alighting passengers and encourages bus usage, even if it's only on days where the bus is only a few minutes away. It's also better for families as there's fewer phone calls home and fewer requests for lifts from the station.

Such details are especially important in cities where train arrivals are unpredictable and buses are infrequent; statistics demonstrate that the train-bus transfer rates for transit systems with mode-based planning such as Melbourne's is much lower than for a master-planned network like Perth’s.

One way to encourage passengers to think of the system as a versatile network (suitable for many trips) rather than a collection of routes (each capable of only a few) is to introduce multimodal elements onto mode-specific maps.

Melbourne has started doing this by indicating points where other modes can be caught with a small square, circle or triangle. However these do not indicate where the intersecting service goes, its route number, frequency, nor even if it is running on the day of travel.

Further advances could be to show intersecting routes, ending up with either a comprehensive local area map or schematic frequent service map. While such maps are useful they can introduce clutter for train or tram-only passengers, especially if applied at the metropolitan-wide scale. Possibly the best compromise are several maps at interchanges for different purposes. Examples could include a schematic metropolitan-wide railway map, a schematic frequent service map (covering about a 10-15km radius), a local pedestrian and bus map and an interchange map for large stations.

There could also be scope to introduce further multimode features on conventional single-network maps. An example is presented below.

This is the familiar Metlink/Metro Melbourne train network map with the three orbital SmartBus routes linking outer suburban stations (effective later this month). Its purpose is to convey a more versatile web-like network suitable for trips other than CBD-direction travel, especially for middle and outer suburban residents.

Detail has been kept low to avoid clutter (the main problem with adding buses). Only the orbital SmartBus routes that link most lines have been included. Hence it could reasonably replace the train-only network map (saving costs and space) without overwhelming the passenger. Additional details of local routes could be given through frequent service maps at the regional level and all-route maps for those making shorter trips. Such more specific maps are more suited to stations and interchanges than on trains, which may travel over much of the network.

Friday, September 10, 2010

Frequent Service Map 2: Melbourne’s north-east

A few posts ago I posted a frequent service map for Melbourne’s south-eastern suburbs to show the area’s high-service train, tram and bus corridors.

You might choose to live along these corridors if you value the choice of not having to drive everywhere. Businesses can establish in these areas and have quality public transport for their employees and customers in at least some directions. Or, if a tourist, you can travel to these locations with the confidence that service will still be running when you want to get home and that you won’t be waiting an hour if a service was missed.

Today’s map covers the north-eastern suburbs – roughly the City of Manningham with a bit either side. It was done in time for the introduction of five SmartBus routes to the area (mostly as part of Doncaster Area Rapid Transit) within the next month.

The map below shows Manningham’s frequent service network from October 4, 2010. The main routes form a grid of roughly 1 to 3 kilometre intervals. These put most of Manningham within 20 minutes walk of at least one SmartBus service. Service levels include a 15 minute weekday frequency until 9pm. At other times buses operate every 30 minutes until midnight, except Sundays where a 9pm finish applies (do people near trains and trams have later bedtimes?).

Click here for higher resolution pdf (recommended for printing or study)

As with the earlier map, continuous lines indicate long service spans and thick lines indicate the highest service frequencies. Low-frequency and peak-only routes are omitted except where they overlap much of a higher service route and boost frequencies along a corridor.

Thursday, September 09, 2010

Politicians, Politics and Transport Authorities

A well-attended forum on public transport took place last night at Melbourne Town Hall. Convened by the Metropolitan Transport Forum it featured speeches from the Minister for Transport, Shadow Minister for Transport and The Greens. There was a period for questions after.

Below are several paraphrased statements followed by observations and questions that could have been raised if there was time.

The Greens member recited neither the Minister’s list of projects nor the Shadow Minister’s list of objections. However he briefly mentioned two topics, that of political involvement and management by transport authority, that are worth exploring in more depth.

Martin Pakula (Minister for Transport)

Buses cannot always connect with trains as they operate at different frequencies

This is a fair description of the present for many bus routes (that might run every 38 minutes not not connect with trains every 20 minutes). However such planned non-connectivity is neither an inevitability nor something that can’t be changed.

Given that buses are largely publicly subsidised, and that you oversee a department charged with service co-ordination under the Transport Integration Act, harmonised frequencies and better connectivity should be both achieveable and affordable.

The second reason why buses cannot connect with trains is that they intersect with many train lines. For instance a SmartBus orbital might link ten stations and scheduling connections is impossible

Much like the frequencies we run our buses, the decision to design our premium routes to be long orbitals serving numerous stations was a choice not an inevitability.

Any choice has certain consequences and compromises.

However it is not correct to accept certain consequences as inevitable without acknowledging that they only came about because certain choices (which were not inevitable) were made (in this case the decision to go with long orbital routes rather than upgraded shorter routes serving fewer stations that would be easier to harmonise and ideally co-ordinate with trains).

Terry Mulder (Shadow Minister for Transport)

There will be 2 protective services officers posted at every suburban station (and major regional stations) from 6pm until last train each night. They will be able to escort passengers to their cars.

This was widely reported in the media when announced. But could the escorting service mean that those waiting for a train (going the other way) would not have staff presence for a while? And will security staff go to the trouble of changing platforms to meet every train (where possible)?

The regional fast rail project was a farce

This project did deliver significant service frequency increases to major centres (sort of a follow-up to 1981’s ‘New Deal’ timetable introduced by a previous Coalition government) and patronage has grown rapidly as a response. It also included a component of ‘catch up’ maintenance.

It is true that V/Line on-time performance is often below standard and the bar for longer trips has been lowered. This is often attributed to the suburban network’s unreliability, along which V/Line trains must travel to the city. While punctuality was said to have deteriorated since the RFR services commenced, I didn’t hear anything that convinced me that RFR was the cause of this decline.

Instead his main argument appears to be that his opponents claimed financial mismanagement of projects including myki ticketing, Southern Cross Station and RFR has meant that infrastructure basics that should have been attended to were not.

Greg Barber (The Greens)

Public transport should not be political… it should be run by an accountable public authority

While it is fashionable to argue that ‘things would be better if they were less political’, I am not sure if this is entirely feasible in public transport. This is due to its dependence on public funding for both capital and operational purposes, and hence requires parliamentary scrutiny of same.

As well as not being feasible, ‘non-political’ public transport may not even be desirable. Political decisions can close lines, reopen lines and build new lines. People pushing unfashionable issues envy those whose interest areas are 'political footballs', since at least they're getting air time. And anyone who watched the interviews with Peter Newman on Perth’s rail revival (available on YouTube) heard that the decision to go with train rather than bus for Perth’s booming northern suburbs was a political decision, whereas most industry insiders favoured bus. In this case had ‘non-political’ public transport prevailed the very successful Joondalup line might not have got built.

Also unhelpful is that the term ‘political’ has come to be synonomous with ‘party political’. However there is also a broader politics tied to public organisation (often around community or interest groups) and participation. ‘Political’ could also mean any activity where people comment on a matter of public governance or interest, for instance suggesting where a bus route should go at a public bus review meeting (such as have recently been held).

In some cases the ‘political’ can indeed result in an inferior network and service for most. This could be due to residents not wanting buses in their street, a handful wanting to retain a bus route deviation that makes the service slower and less legible for the majority, or a group who succeeds in obtaining a new route, even though that bus would have met a greater need or attracted higher patronage elsewhere.

Nevertheless there is also a principle that those in remote pockets (even if the ‘remoteness’ is due to a developer’s transit-hostile street layout) should have some service on social equity grounds. This principle is strongly supported (sometimes at the cost of frequency and directness) by the Department of Transport and the Minister (who reiterated the ‘within 400 metres of public transport’ rule last night).

I suspect that many would be surprised at the number of route rationalisations that a business-minded public transport planning authority with a strong charter to maximise patronage for its budget might make. It would certainly mark a reversal of the last few years, which have seen the combination of (a) significant funding of new services, including some new routes that partly overlap existing routes, (b) limited development of headway harmonised timetables and non-SmartBus frequent service corridors, and (c) a reluctance to prune existing routes that may have outlived their justification for existence.

If the experience of Perth’s bus route reform (an ongoing process, but started in earnest in the late 1990s) is anything to go by, a transport planning agency would likely to concentrate on (b) and (c), much of which requires little funding. Funds for (a) would likely be gladly accepted, but this depends on the government of the day (hence the political component will never be avoided).

Evidence such as patronage and patronage potential data is cold comfort to those who have lost their local service, especially if mobility impaired. However some may gain if frequency and connectivity on existing nearby routes is improved. This is why it’s better to delete superflous routes (eg 694) at the same time that existing routes (688) are boosted so that even those left with a longer walk at least gain from higher frequency).

There will be some changes that may never be accepted and there will be constant political pressure for their reversal. This could well come from the very politicians who purported to support an service planning agency.

Although we have few (if any) routes that run on a commercial basis, an approach we could follow is to have most planning on the basis of patronage potential and strategic network importance, along with supplementation for ‘social needs’ routes. These may be less direct and frequent but provide coverage to pockets that cannot be justified as being part of the core network. To a large extent even funding for these would likely be politically determined, proving again that the political cannot (and probably should not) entirely be taken out of public transport.

Sunday, September 05, 2010

An updated 'Zen'

For a complex asset that cost so much to build, the information presented to passengers on the use of the City Loop is decidedly sketchy. As suggested here before, this may be because the City Loop is only regarded as a CBD distributor for suburban passengers (its original purpose) rather than also forming a transit system in its own right for inner-city trips.

The Metlink journey planner has revolutionised trip planning, but there remains no officially-produced printed or web publication telling people how the loop works. The only known exceptions are pamphlets issued to passengers on a particular line when alterations occur as part of a new timetable. Instead one needs to plough through timetables for each line to build a picture of how it works, something most passengers are unlikely to do.

For many years this gap was filled by the Zen and the City Loop website. It's existed for about as long as Melbourne public transport has been on the web and has legendary status amongst transport geeks.

Unfortunately, though still mostly correct, 'Zen' is showing its age, with content not reflecting changes in the last year or two.

For another purpose I started producing some Loop diagrams. Something about the Zen diagrams must have stuck in my mind since there is a signficant resemblance, despite not having looked at them for a year or more. Anyway for posterity these diagrams, based on the June 2010 timetable, are presented below.

Note that these diagrams reflect the June 2010 timetable and will change again after the 10 October 2010 timetable takes effect.