Go back ten or fifteen years and transport execs and politicians would nervously await the release of the 'Track Record' train performance figures each month. For it was nearly always bad news. As fast as patronage was surging operational performance was dropping.
On the hard-hit and electorally sensitive Frankston line, lateness surged from 1 in 20 to almost 1 in 2 trains at the peak of the troubles. The Brumby government had lost control of the system and there were widespread calls to 'sack Connex'.
Which eventually they did in 2009 by not renewing its operating franchise and giving the job to Hong Kongers. But changing a few bosses at the top and leaving everything else the same gave no relief, with performance continuing to deteriorate in Metro's early years.
You can see the trend in the Track Record graph below. Good punctuality up to the end of 2003, a long-term fall up to the 2011 nadir, a fast recovery for a few years after then, as I pointed out here, a slow decline up to 2020. There were also some industrial issues, making it not a nice time to be a novice minister. Click graph below for clarity.


And it was important for them to get on; it was quite possible that the next one would be cancelled or even fuller. And timetables had numerous inconsistent stopping patterns (like Ringwood trains still do) so even if everything ran on time waits could still be longer than desirable to the next.
The patronage graph stops at 2011. But growth has levelled off so there's not much to see since. For example annual boardings would not have exceeded 250 million trips per year in 2019. That provided breathing space for the big punctuality turnaround that happened around 2012. Contributing factors included reformed simpler timetables, particularly on the unreliable Dandenong, Frankston and Werribee lines and some improved peak frequencies.
There were at least two other factors as well, one enduring, one (fortunately) not so.
Passengers noted some timetable padding with the 40-odd kilometre trip to Frankston (for example) now taking well over an hour. Mernda is another slow line. The longer run times made it easier to meet performance standards. Depending on how you saw it, it was either a recognition of reality or a 'free kick' to the train operator.
Train cleanliness also slipped. Metro around 2014 was running a filthy and heavily graffitied fleet. Laxness here would have helped operational statistics if the threshold for taking trains out of service was higher. It's worth nothing that 2014 was also a mid-franchise year, a time when PTV's franchise contract management was weak and operators could cut corners and get away with stuff (and not just with trains either).
However as contract renewal approached in 2017, Metro smartened its act and greatly improved train presentation. Apart from neglect of Saturday and Sunday morning carriage cleaning (an unresolved issue from Night Network), train presentation is now as good as it has ever been (for at least 30 if not 50 years).
Returning to punctuality, you'll see an uptick at the end. This coincided with city commuters working from home rather than catching the train due to COVID-19 restrictions. Like Yes Minister's hospital with no patients operational performance is best when there are few customers.
The critical difference between modes is what happens when patronage rises beyond a few people. If more try to use flexible route buses then performance slips greatly with every added passenger (as the bus has to deviate past their house, slowing the trips of all other passengers). Whereas an extra passenger on mass transit modes has close to zero impact provided the system is not over capacity. The graph below tells the story, with performance diverging as patronage rises.
On the hard-hit and electorally sensitive Frankston line, lateness surged from 1 in 20 to almost 1 in 2 trains at the peak of the troubles. The Brumby government had lost control of the system and there were widespread calls to 'sack Connex'.
Which eventually they did in 2009 by not renewing its operating franchise and giving the job to Hong Kongers. But changing a few bosses at the top and leaving everything else the same gave no relief, with performance continuing to deteriorate in Metro's early years.
You can see the trend in the Track Record graph below. Good punctuality up to the end of 2003, a long-term fall up to the 2011 nadir, a fast recovery for a few years after then, as I pointed out here, a slow decline up to 2020. There were also some industrial issues, making it not a nice time to be a novice minister. Click graph below for clarity.

You'll see that the 2003 - 2011 slump coincides perfectly with the 2000s train patronage surge as graphed below. As trains got more crowded their dwell times increased as people struggled to get on.

And it was important for them to get on; it was quite possible that the next one would be cancelled or even fuller. And timetables had numerous inconsistent stopping patterns (like Ringwood trains still do) so even if everything ran on time waits could still be longer than desirable to the next.
The patronage graph stops at 2011. But growth has levelled off so there's not much to see since. For example annual boardings would not have exceeded 250 million trips per year in 2019. That provided breathing space for the big punctuality turnaround that happened around 2012. Contributing factors included reformed simpler timetables, particularly on the unreliable Dandenong, Frankston and Werribee lines and some improved peak frequencies.
There were at least two other factors as well, one enduring, one (fortunately) not so.
Passengers noted some timetable padding with the 40-odd kilometre trip to Frankston (for example) now taking well over an hour. Mernda is another slow line. The longer run times made it easier to meet performance standards. Depending on how you saw it, it was either a recognition of reality or a 'free kick' to the train operator.
Train cleanliness also slipped. Metro around 2014 was running a filthy and heavily graffitied fleet. Laxness here would have helped operational statistics if the threshold for taking trains out of service was higher. It's worth nothing that 2014 was also a mid-franchise year, a time when PTV's franchise contract management was weak and operators could cut corners and get away with stuff (and not just with trains either).
However as contract renewal approached in 2017, Metro smartened its act and greatly improved train presentation. Apart from neglect of Saturday and Sunday morning carriage cleaning (an unresolved issue from Night Network), train presentation is now as good as it has ever been (for at least 30 if not 50 years).
Returning to punctuality, you'll see an uptick at the end. This coincided with city commuters working from home rather than catching the train due to COVID-19 restrictions. Like Yes Minister's hospital with no patients operational performance is best when there are few customers.
The critical difference between modes is what happens when patronage rises beyond a few people. If more try to use flexible route buses then performance slips greatly with every added passenger (as the bus has to deviate past their house, slowing the trips of all other passengers). Whereas an extra passenger on mass transit modes has close to zero impact provided the system is not over capacity. The graph below tells the story, with performance diverging as patronage rises.

Most benefits of public transport (think space efficiency, economic, social and environmental benefits) accrue when it is well used. It follows then that we only get these benefits if the mode chosen can support high usage while remaining reliable and punctual.
Trains and fixed bus routes can achieve that whereas flexible route buses do not. Where flexible bus routes are carrying more than a handful of people at a time then they should be upgraded to a regular fixed route bus for better punctuality. If a regular bus regularly reaches capacity then it needs higher frequency, larger vehicles, its own road space, wider doors, off-vehicle validation and all the other things that makes it more like a rail service. And if regular trains get overloaded, like ours did in the 2000s, then we need a better system and service, comprising improved maintenance, upgraded infrastructure, more trains, revamped signalling and refreshed timetables. They happened later than they should but we eventually got improvements here and performance rebounded.
The past 15 years has thus taught us what happens to performance when patronage booms. What about if it slumps? 2020 was an interesting case history of that. Below is a close up of Metro train performance. When the COVID restrictions were more severe patronage fell and punctuality improved. Then when they were loosened some passengers returned and delays increased. However both remain well down on pre-COVID times.

Hence the inverse relationship between patronage and punctuality appears symmetrical, whether usage falls or rises. Trams and V/Line appear to exhibit similar behaviour. Data for buses, being Melbourne's 'invisible mode', is not reported. However buses may turn out to be the 'silent sufferers' as car traffic rises to exceed pre-pandemic levels. A little more on them later.
Less clear is the performance on service delivery (ie trains that are not cancelled). The graphs below show the 20 year trend. There was excellent performance in the early franchising period that was never quite met since. In the most recent pre-COVID period there was a steady deterioration. It might not look much, but a drop from 99.5% to 98.5% means triple the chance of your train being cancelled.
Less clear is the performance on service delivery (ie trains that are not cancelled). The graphs below show the 20 year trend. There was excellent performance in the early franchising period that was never quite met since. In the most recent pre-COVID period there was a steady deterioration. It might not look much, but a drop from 99.5% to 98.5% means triple the chance of your train being cancelled.
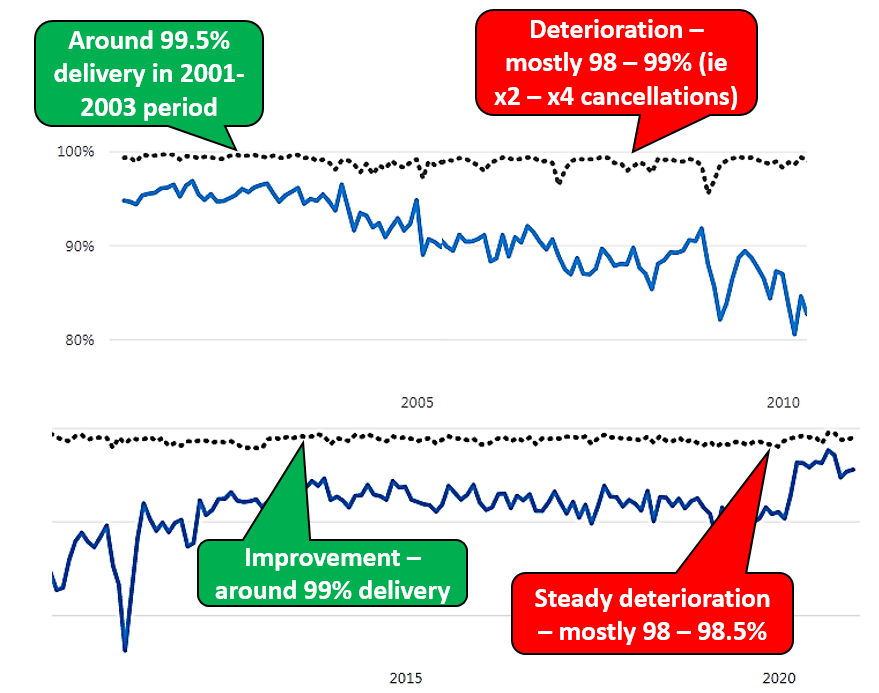
Below shows more recent times. Cancellation rates approached 2% in January 2020. This was close to rates experienced in the Brumby era (a bad time for train travellers). This happened due to a gradual drop in performance rather than due to high-profile network meltdowns that were more common 10 years ago.

Performance recovered in September/October 2020, ie around the height of the lockdown. In those months 99.4% of trains ran. This was very close to the excellent 2001-2003 performance. However train patronage was depressed and the good numbers were not to last, even though patronage is still relatively low. In the most recent available month (January 2021) service delivery had dipped below 99%, ie similar to some earlier pre-COVID months. There must have been something that was done prior to 2003 that we haven't been doing lately since cancellation rates have never been as consistently low as back then.
How has V/Line gone? It's been a bit different from Metro with their paths diverging. Metro improved about 9-10 years ago while V/Line showed no such gain. In fact the latter's service delivery continued to deteriorate. That's a worry given that whereas the wait after a cancelled Metro train is rarely over 30 minutes, it can be several times that for a V/Line train due to lower country area frequencies. On the bright side punctuality improved. Mostly to about 2004 levels but during the height of the COVID lockdown (when Melburnians couldn't travel more than 5km) to the best numbers for over two decades. That's been followed by a post-COVID slump (graph below).

It is clear that V/Line has systemic issues with its performance, like metropolitan trains had about 10 years ago. The Ballarat Line Upgrade and new timetable that came on stream January 31 might help. Or it might not. If we look at history, the major V/Line infrastructure works and timetable upgrades in 2006-2007 and 2015 (ie the Regional Fast Rail and Regional Rail Link projects) appear to have had no discernible impact on performance. However they did boost frequency (reducing waiting time until the next service). Also patronage (which probably harmed punctuality) increased.
Trams have a pattern more like V/Line but with less volatility. Cancellations are up on five years ago. Punctuality had a period of improvement but this had levelled out by 2015. However the reduction of road traffic during the height of the lockdown delivered big punctuality gains during our most confined months. We were freer in January 2021 than we were in October and accordingly traffic volumes have risen as have tram delays.
How has V/Line gone? It's been a bit different from Metro with their paths diverging. Metro improved about 9-10 years ago while V/Line showed no such gain. In fact the latter's service delivery continued to deteriorate. That's a worry given that whereas the wait after a cancelled Metro train is rarely over 30 minutes, it can be several times that for a V/Line train due to lower country area frequencies. On the bright side punctuality improved. Mostly to about 2004 levels but during the height of the COVID lockdown (when Melburnians couldn't travel more than 5km) to the best numbers for over two decades. That's been followed by a post-COVID slump (graph below).

Trams have a pattern more like V/Line but with less volatility. Cancellations are up on five years ago. Punctuality had a period of improvement but this had levelled out by 2015. However the reduction of road traffic during the height of the lockdown delivered big punctuality gains during our most confined months. We were freer in January 2021 than we were in October and accordingly traffic volumes have risen as have tram delays.

Buses? Monthly performance information is not publicly reported as it is for trains and trams. However there are clearly issues with road congestion as advised by bus operators around Melbourne.

To summarise, all modes had improvements in performance when we had little road traffic and few passengers. All have given up some of those gains afterwards. However there remain systemic issues, such as V/Line's unreliability and rising traffic for trams and buses that will have a large bearing on performance longer term.

To summarise, all modes had improvements in performance when we had little road traffic and few passengers. All have given up some of those gains afterwards. However there remain systemic issues, such as V/Line's unreliability and rising traffic for trams and buses that will have a large bearing on performance longer term.
See all Timetable Tuesday items here
No comments:
Post a Comment