Thursday, July 27, 2023

Guest post: This week's Adelaide bus changes


I've written about Adelaide twice. Firstly in 2020 about their aborted radical bus network reforms and then in 2021 when I compared public transport services across the larger Australian capitals (including Adelaide)


They've since had a change of government, with the Liberals losing to Labor. Most political attention has been devoted to reversing privatisation but there have been some bus changes starting this week.  

To take us through them I am pleased to welcome Tom (@AussieWirraway on Twitter) who has provided this guest post.  


Introduction

This is a featurette covering themes in Adelaide bus planning, and changes that while minor, are worth writing about as we take stock on the motivation for bus reform of an overly complex network. This week saw some notable changes and service improvements to Adelaide Metro’s bus network. 

For the first time since about 2017, bus service hours will increase. Since the failed Network Reform of June 2020, Adelaide’s bus network has remained unchanged, but these improvements are not all sunshine and rainbows. 

The South Australian Public Transport Authority (SAPTA) is reverting to an old model of service improvements, that ignore their own context, and especially in the case of the 206/208 have been implemented in ways that leave a lot to be desired. This post will (try to) briefly cover these service improvements – the good and the bad.

Frequency upgrades

The best reform to come out of these services changes is route 206 to Lightsview becoming a “Go-Zone” bus, which dictates service levels of every 10 minutes in the peak, every 15 minutes at other weekday times from 7 am to 6:30 pm, and every 30 minutes all other times to last service and on weekends. 

The 206 is an existing bus that was previously peak only, running every 15-20 minutes to the city between 7 and 9:30 am, and outbound between 3 and 5:30 pm. That’s a very good improvement! For context Lightsview is an infill suburb in middle Adelaide and was home to 6,090 people on census night, it has one of the highest suburban densities in Adelaide. (click image below for a clearer view)

However, this Go-Zone provides limited new coverage over an existing one, adding just 9 stops to the existing Galway Avenue Go-Zone as shown on the above map (That’s not even to mention the fact that 3 of these stops are already served by the 202/203 go-zone on Hampstead Road!). 

The 208 remains unchanged despite the 206 improvements making it increasingly redundant. The 208 is a bus that provides a link through the middle Northeastern suburbs from the City to Paradise Interchange, it’s a good route, with strong anchors at either end, but outside its go-zone has relatively poor operating hours. 

On weekends, for example, the last bus leaves Paradise Interchange for the city at 5:42, with all trips until midnight being 208N (N for terminating in Northgate). This remains unchanged in the timetable; indeed, the entire 208 timetable remains unchanged every day of the week, except that 208B (B for terminating in Broadview) trips have become full 206 trips. This means that on weekdays between the city and Regency Road where these services split has an uneven frequency, as a bus running every 15 minutes meshes with one running every 30 minutes.

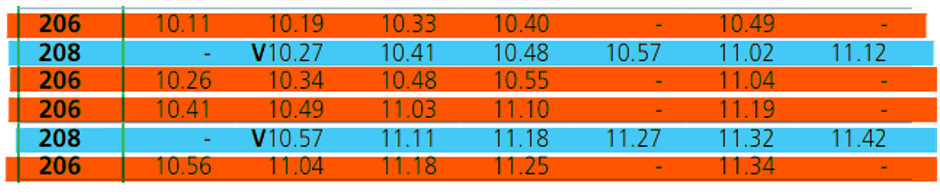
Take this sample for buses running from the city in the 10 am hour, if you live south of Regency Road, these are not easy to remember clockface frequencies. On weekday nights this does mean frequencies are double what they are now, and Galway Avenue, Walkerville Terrace and Melbourne Street now all have buses every 15 minutes until 11:30 pm, a very high level of service and rare in Adelaide.

Weekends are even weirder, with the 206 running every 30 minutes and the 208 running every hour, 30-minute waits for buses will still be common, and instead of meshing buses on Galway Avenue better, SAPTA has instead decided to have buses run more evenly to Stop 26, Folland Ave, Northgate.


So don’t get me wrong, these service improvements are more than welcome and should have been done years ago, but watching in real time such a mistake being made is bizarre. There were other options here, including buses that used the O-Bahn to Klemzig Interchange like the existing Lightsview bus, the 528, or combining the new frequent 206 with the tail end of the 208 to Paradise Interchange and deleting other parts of the 208 no longer needed. 

This is poor route reform, but planners likely know this. Implementing a Go-Zone to Lightsview was a half-hearted commitment of the Government at the 2022 election, and I wasn’t even aware of it till told recently. It’s unknown when the decision was made to pursue this change, as SAPTA had zero public window for public consultation, it appeared in the June state budget and has now been implemented in slightly over a month. 

That’s a good timeline and speaks well of SAPTA’s ability to implement new timetables, and operators' ability to schedule drivers and buses to fill changes. Torrens Transit, who will operate the new 206, has struggled for drivers since 2021, which has led to new less intensive peak timetables in many parts of Adelaide. This is hopefully a sign that the 2019 timetable can once again be implemented in full.

Northern suburbs, new route


Casually announced on the Adelaide Metro website a few weeks ago was a brand-new bus route, the evenly numbered 450 to serve a new growth area in Adelaide’s north. Riverlea Park is currently not a particularly large community, the local council estimates a population of around 800 people, but by 2041 should be 11,000. It also benefits the current 2,000 residents in the small town of Virginia, who for the first time will have a regular connection to the Adelaide Metro network, which is decades overdue.

The 450 is presented as the main route to this development, and will likely become a frequent one in future, running essentially express along vacant farmland to Elizabeth railway station and city centre. At the same time, the presence of the 450 has caused the existing 4 times daily route 900 (which was basically the 402 and 450 combined as one bus via Virginia) to be deleted and reformed into the new 402, a 6-trip daily, peak route from Riverlea to Salisbury railway station. It’s not a traditional express route and takes longer than the 450 but offers an express train connection on the Gawler line.

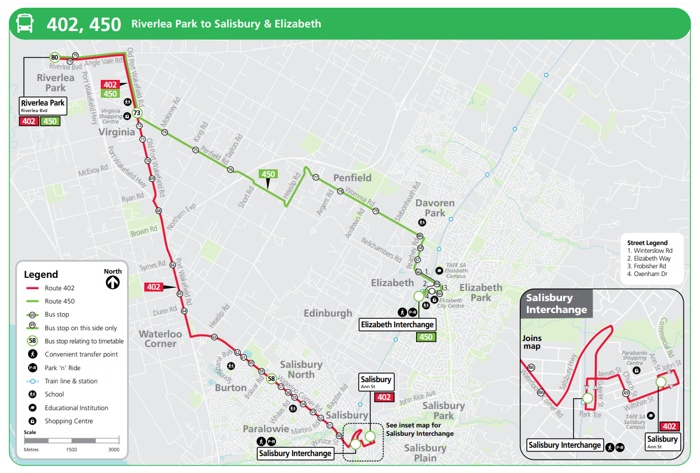
The 450 has the bones of a good route and is ultimately sensible, but its hours of operation could be significantly improved. Inbound to Elizabeth it runs hourly from 6:20 am until 2:49 pm. Outbound from Elizabeth it’s the same, hourly from 10:15 am until 7:15 pm. Residents coming back from the city in the evening certainly won’t want to miss the 6:38 pm Gawler Central train, as it’s the last one that makes a bus connection. I also haven’t mentioned that both the 402 and 450 are weekday-only routes, which while understandable for the 402, is very disappointing for the 450. 

These hours of operation are not fantastic and are indicative of the very limited funding currently available. Given that many of the PM trips terminate in Riverlea Park without forming inbound services, buses will head out of service to the depot or a form a different route elsewhere. Edinburgh North depot, where the buses are stabled, is a 5-minute drive from Elizabeth station! 

Running these completely unavoidable trips in service back to Elizabeth station rather than deadheading can add no more than 15 minutes to a driver’s roster, but it’s not here. There was no governmental budgetary announcement for either the 450 or 402, and no consultation from Adelaide Metro, which perhaps indicates that these services are funded by the developer of Riverlea as part of its services obligation, and that from the axed 900.

Overall, the 450 is a solid bus route and one that will be very useful for the residents of Riverlea to reach the city and local Elizabeth shopping and government services. As the area gains more residents more funding is likely to become available to increase the hours of operation and the frequency of the route, while the 402 remaining a peak-only route largely makes sense, but the trip does need to be faster.

Splitting a corridor, less frequent buses

In the definitely questionable “did this really need to change?” territory is the splitting of the 230 and 232 frequent go-zone corridors. The 230 and 232 currently have a go-zone standard route from stop 31 Torrens Road to the city, providing wide, frequent coverage to many residents in the northwest outside the reach of the Outer Harbor line, and providing one of three frequent corridors to the Arndale shopping centre. 

These changes, as shown below, have split this route much earlier than it does today, at stop 10 Torrens Road. This is so the corridor can serve Days and Harrison Road, as they previously did before the South Road upgrade.

This change sees the 232 significantly increase its runtime (several minutes) due to a substantial deviation it now must complete. One which mainly parallels the Gawler train line, which also offers a much faster trip into the city, it also fails to interchange with that rail line providing no new stops for passengers wanting to make a transfer. The 230 and 232 will see no other changes to their frequency both running every 15-20 minutes in peak, 30 off peak and hourly in the evenings and weekends. 

This is a very hard change to justify which increases the travel time for passengers, significantly impacts clockface frequency for many more residents than it benefits, and overall seems like a downgrade on the existing network. There are also some weird oddities in the peak timetables for this bus, but for the sake of brevity, I won’t mention them here.

The consultation for this change occurred in November 2022, so the lead time on this one is approximately 8 months, however, no outcome from the consultation was ever publicly released. At the time of the consultation, I publicly advocated for people to write submissions against the change, but Adelaide Metro has adopted it along with this other suite of reforms. However, this one isn’t too complex, but is a shame for such a marginal benefit saving so few minutes of walking for a few hundred residents.

Conclusion

This set of bus changes is entirely unrelated to one another, occurs essentially in completely different contract areas and had no right to all be implemented on the same day in late July, but it can't be denied it's convenient for me. 

Overall, this is a mixed bag of changes, especially given that what is good here, could have been unashamedly better if more attention was paid to network reform. All the changes apart from those to the 230 and 232 are worthwhile, but I hope you'll agree it could have gone further. 

This was a lot of words to talk about what's essentially three changes to buses in Adelaide. The long and short of it is that it does demonstrate the fact that SAPTA can do reform quickly, and the public consultation isn't necessarily seen as something that “must” be done before implementing a change seen as “without downside,” demonstrated both with the 450 and 206 changes. 

A lack of consultation has seen the downfall of previous plans, the 2020 new network proposal is a case in point here, but equally, I don't have a real problem with announcing these changes a few weeks out from their implementation. 

I'm glad to see some changes happening, and if kept in motion I'll be interested to see what might come up next, namely the timetable revision for the Gawler rail line should be due sometime before the end of the year, which offers a strong opportunity to reform many parts of the northern bus network. 

But with the government focused on bringing the train and tram networks back into public ownership, it remains to be seen if this is a priority or not.

Follow Tom on Twitter 
Tom is also involved in advocacy group People for Public Transport

Opinions expressed above are Tom's alone and the above is presented as supplied. Thanks to Tom for this contribution. 


Thursday, July 20, 2023

Most productive bus routes: 2022 edition


Public transport patronage is a good thing. The more people use a bus route the more the community and individual benefits. Monitoring patronage is key to planning networks and services. Especially if you want to optimise usage per amount of service provided (something that's regular practice in Perth but rarer here). Right now there is also interest in how usage patterns have changed post-lockdown as some habits developed during the pandemic, such as white collar working from home, seem to be proving enduring. 

Back in 2019 I looked at the previous year's bus boardings per hour data for weekdays and weekends with a focus on the most productive routes. The most productive weekday routes were either those serving universities or in suburbs with diverse high-bus using populations like Tarneit, Truganina, Point Cook and Craigieburn. On weekends routes to major shopping centres like Chadstone, Box Hill and Doncaster did best. While high productivity is a good problem to have, it can also mean that we are skimping on service and thus forgoing patronage growth, as discussed in detail here.   

Earlier this year I requested and received similar bus productivity data for September - November 2022 from DTP. More on that later. But first, let's discuss the 'elephant in the room'..

Data accuracy

I know what everyone's asking: "How do they know how many people are using the bus when so many people aren't touching on?".

It's a good question. Some say that buses in Melbourne risk becoming like trams were about 20 years ago with regards to fare evasion's prevalence and even social acceptability. Official interest in encouraging compliance is perhaps not what it was, especially after buses stopped doing myki cash top-ups during the pandemic and lower patronage meant less foregone revenue (compared to if everyone touched on) anyway. Also mass rail shutdowns and bus replacements got people used to boarding buses without touching on, which may have weakened reflex behaviours when riding regular buses.

While it wasn't in force in the 2022 period we're looking at, a popular view of proportionality or fairness is that a short trip should cost much less than travel across the state. Hence Labor's now implemented $10 statewide daily fare cap (a 2022 election sweetener) risks undermining the legitimacy of paying for short trips in some minds. Something to keep an eye on as we compare the differences between good policy and 'race to the bottom' election politics. 

Graphs published in the DoT Network Revenue Protection Plan 2022 (p6) show that myki's introduction coincided with improved fare compliance for Metro trains and trams, but not for buses, which spent long periods as the mode with the highest proportion of non-payers. A pre-pandemic recovery in compliance proved short-lived, with the last recorded (late 2021) compliance for bus falling from 96% to 90.6%, the lowest of all modes.

In transport's nonchalant head-office world a non-compliance rate of still less than 10% probably weakens the potential short-run returns from the costs of greater enforcement to the extent that they are willing to forgo some compliance. And 90% would seem pretty good to some. And they know that not everyone who doesn't touch on is necessarily evading a fare, especially if they've just come off a train via a station with barriers. 

However in the 'real world' bus riders on some routes see far more than 10% of passengers not touching on. That's significant as touching on is a learned behaviour that you want everyone to develop into a reflex habit.

When people see others not validating this encourages copycat behaviour that lessens long-run compliance and, important for today's discussion, data accuracy. There are also cases where passengers who wish to touch on cannot due to defective or booting up myki readers at the start of a run.   

How do people not touching on affect the ridership statistics that I'm about to discuss? As it turns out DTP is well aware of people not touching on. Thus they use survey data to boost numbers to account for non touch-ons and improve data quality.

However, given variations in the scale of non-compliance (and thus any data compensation factors), you should still prepare for inaccuracies when reading what follows. The disclaimer with the supplied data warns users of this, saying that 'this methodology provides estimates at the macro level'. 

Hence my use and interpretation of the data will be cautious. And if I think parts are wrong I'll tell you.  

Enough of the caveats. What do the numbers indicate?

Most productive weekday routes in 2022

The top ten are as follows (most productive first): 

601 University shuttle: Huntingdale - Monash
733 Box Hill - Monash - Clayton - Oakleigh
182 Werribee - Tarneit (new route)
703 Brighton - Clayton - Monash - Blackburn
401 University shuttle: North Melbourne - Melbourne University
152 Williams Landing - Tarneit (new route)
486 Sunbury - Rolling Meadows
170 Werribee - Werribee Plaza - Tarneit
907 City - Doncaster - Mitcham
495 Williams Landing - Point Cook South

Like with the 2018 numbers, routes serving universities continue to get high boardings per hour. These include 401, 601, 703 and 733.

Also, like last time, a similar number of top performing routes were in the City of Wyndham (152, 170, 182 and 495). Of special note is that 152 and 182 are new routes that did not exist before 2021. This shows that in the City of Wyndham you can throw just about any bus service out there and people will flock to it, even if it's only every 40 minutes off-peak. The high usage means that these routes would easily justify a 20 or even 10 minute service with longer operating hours. The April 2022 Craigieburn upgrades are a good precedent for this. 

Only two non-university or non-Wyndham routes appears on the list. One of them I can believe but the other I can't. The 907 is a popular route on Doncaster Rd. Other routes overlap parts of it but the 907 is direct, has long operating hours and is more consistently frequent 7 days per week. This makes it close to being a rubber tyred tram with high travel speeds due to its freeway running. Thus it's no surprise that people use it.

Route 486, on the other hand, is a Sunbury local route through an area with fairly low population density and little demographic propensity to use non-school public transport. And it's never been busy on the few times I've ridden it. Maybe the number is right but I'm still surprised that this and some other Sunbury routes appear so highly placed. 

Have any of these routes seen recent service increases to reflect their high productivity? Some have.  152 and 182 are new routes, starting only in 2021. 733 gained frequency upgrades on its busiest portion in May, with funding from the 2022 state budget. And 2021 saw improvements to 907 including higher weekend frequency and 24 hour weekend service. 

601 (the Monash shuttle) recorded over 100 boardings per hour. The rest of the top 10 had between 39 and 49 boardings per hour. However there's some important still productive routes in the next ten that sit just below that with weekday boardings in the 33 to 39 per hour range. These include: 

900 Caulfield - Rowville
481 Sunbury - Mt Lion 
160 Hoppers Crossing - Tarneit
497 Williams Landing - Saltwater Coast
485 Sunbury - Wilson Lane
623 St Kilda - Glen Waverley
737 Monash University - Croydon
246 Elsternwick - Clifton Hill
150 Williams Landing - Tarneit
800 Chadstone - Dandenong

Two of the 'second ten' routes (900 and 737) serve Monash University. Three (150, 160, 497) are in the City of Wyndham. This time big shopping centres come in with three (623, 800 and 900) serving Chadstone and 737 serving The Glen. 246 on Punt Rd is a popular frequent inner city route that has been the main subject of the 'rapid running' trial. 

The remaining two (481 and 485) are short local Sunbury routes whose figures surprised me as noted before. Also route 800 stands out as being, apart from the university shuttles, the only top 20 route without Sunday service and only a skeleton Saturday service including two hour gaps in the afternoon. Indeed you would have to go down to almost the 50th most productive route to find another with such limited service. This makes the 800 an outlier and a demonstration that in Melbourne you can have strong usage but wait decades for timetables to be adjusted accordingly.  

Weekdays - the bigger picture

There are exceptions but bus route numbers in Melbourne are roughly clustered by area, and in some cases, operator history. Hence under 200s are mostly Wyndham area, 200s inner ex Met routes, 300s outer north, 400s west, 500s north, 600s and 700s east, 800s outer south-east and 900s SmartBus. I plotted productivity in route number order below. 


The productive clusters in Wyndham and around Monash University stick out. As does the cluster around Sunbury whose high numbers I questioned before. I'm also wary about some of the known high usage routes like Sunshine's 216 and 220 whose productivity I'd expect would have been much higher.

Genuinely quieter routes are found in parts of Melbourne's outer east and outer north, eg around Lilydale, Belgrave and Mernda whose population density and demographics are weaker for buses than areas around Sunshine (labelled 'West') and Dandenong.

Route 900 - 908 SmartBuses are a mixed bag. 900 and 907 have no really quiet sections, with 907's freeway running being offset by high productivity along almost the whole route. 901, 902 and 903, the very long orbital SmartBuses, have some very busy sections but quieter segments stop them being prominent in route level productivity (as opposed to raw patronage) data.  

How has average productivity changed in the last few years? Weekday buses in Melbourne averaged about 22 boardings per hour pre-pandemic (median measure). The median in 2022 is lower at around 15 boardings per hour. I might discuss this at a later time but will be tempering any conclusions due to concerns over data quality arising from counting or non-validation factors.   

Most productive 10 Saturday routes in 2022

Many familiar route numbers productive on weekdays are also productive on weekends. But there's a couple of new entries. 

900 Caulfield - Rowville
623 St Kilda - Glen Waverley
733 Box Hill - Monash - Clayton - Oakleigh
626 Middle Brighton - Chadstone
279 Box Hill - Doncaster
508 Moonee Ponds - Alphington
907 City - Doncaster Rd - Mitcham
703 Brighton - Clayton - Monash - Blackburn
246 Elsternwick - Clifton Hill
800 Chadstone - Dandenong


Weekend usage appears to be driven by the big shopping centres. No less than 7 of the 10 listed routes serve either Chadstone, Box Hill or Doncaster centres. Four (703, 733, 800, 900) go to or near Monash Clayton, indicating a strong bus using demographic in the area. Inner suburbs across the north and east also find buses useful for cross-suburban trips with the 246 and 508 featuring. 

Service levels remain an issue, with more variation on Saturday than weekdays. For example routes like 246 and 907 enjoy a 15 minute frequency during the day whereas 623 and 626 only run hourly. 800, as discussed before has the least service, with two hour gaps in the afternoon and a finish before 4pm from Chadstone. Routes that have recently had weekend frequency upgrades include 279 and 907 (2021) and 733 (2023). All of the Saturday top 10 operate Sundays except for Route 800 (discussed before). 

Sitting below the top 10 include routes like 631, 767, 742, 506, 495, 170, 402, 182, 903 and 624. Chadstone remains a drawcard, being on routes 624, 742, 767 and 903 with two of these also serving The Glen. Both Wyndham (170 and 495) and the inner north (402 and 506) are represented. So is the Monash area and Southland with the 631. 

Route 767 had a frequency upgrade in May following 2022 budget funding. Route 506 in Brunswick is a lot like the 800 in that it's a busy but neglected route with no Sunday service. It ranks 14th on Saturday. As I'll show later, the most productive bus routes on Sundays are closely correlated with those that are productive on Saturdays. Thus if 506 were to get Sunday service it would likely attract more boardings per hour than about 90% of routes that currently operate on Sundays.  

It's also worth mentioning the 903 which appears in the top 20 but not the top 10. This is a long orbital route with busy and quiet segments. If only the eastern and possibly northern segment was considered it would likely rank in the top 10. Similar comments would apply for the 902 (just out of the to 20), which can be standing room only around Glen Waverley and Springvale along with parts of the 901.  The combination of high usage and low frequency particularly afflicts these orbital routes on weekends. 


The need to boost weekend bus timetables is well understood in senior circles. Including Infrastructure Victoria's Director of Policy and Research and Minister Ben Carroll who recently made the following comments in relation to buses in Ballarat (but also relevant state-wide).    


Most productive 10 Sunday routes in 2022

Mostly like Saturday's list but with some differences, possibly due to potential data quality issues on some routes (*). More later.  

900 Caulfield - Rowville
508 Moonee Ponds - Alphington*
623 St Kilda - Glen Waverley
733 Box Hill - Monash - Clayton - Oakleigh
626 Middle Brighton - Chadstone
555 Epping - Northland*
703 Brighton - Clayton - Monash - Blackburn
556 Epping - Northland*
631 Southland - Waverley Gardens
630 Elwood - Monash University


High productivity is again generally associated with large shopping centres and/or the Monash precinct. Service levels on all routes are generally low. Each route listed runs every 40 to 60 minutes except for the 703 and 900, which run every 30 minutes.

279 and 907 remain productive but drop out of the top 10. So does the 800, but this doesn't get a chance to be ranked because it doesn't run Sundays.

Sunday versus Saturday productivity

A worthwhile graph I did last time was to compare Sunday with Saturday productivity. In a nutshell, the most productive routes on a Saturday were also highly productive on Sunday. Especially where Saturday productivity was high but Sunday productivity was even higher it could identify routes that were underserved on Sunday. The exercise could also be a 'sense check' of data quality to identify data anomalies that are worth questioning before drawing too many conclusions. 

Here is it repeated with the 2022 numbers (click for a clearer view): 


Like last time there remains a high (though apparently less) correlation between Sunday productivity productivity and that on a Saturday. You do need to be aware that service levels vary - some routes operate similar frequencies on Sundays as they do Saturdays while others might be only one-third as frequent (eg every 60 min vs every 20 min). Hence a route can be more productive on a Sunday than a Saturday (ie well above the diagonal line) but ridership remains less due to fewer trips run. This is particularly in safe Labor low car ownership areas where people will crowd onto buses despite unattractive service levels. 

Very productive routes

Routes towards the top right are very productive on both days and are underserved. Route 900 is the stand-out example but the 733, 623 and 626 also show clearly. The latter three all used to run hourly but the 733 got upgraded to operate every 40 minutes in May. 

279 and 907 are a fair distance below the 1:1 line, though Sunday productivity remains at a healthy number in (say) the top quarter of routes. This may be explainable by the 2021 service upgrades which delivered improved frequencies on both. This will likely have attracted some increased usage.  However the survey period was barely a year after the improved services were introduced and short-run elasticity is typically well under 1 (eg 0.5). The result is a bit less productivity, even though it remains above most other routes and overall usage may have grown. 

Routes without Sunday service

Another interesting cluster hugs the x-axis. These are routes that have zero Sunday boardings due to the absence of service. The higher productivity Saturday examples are labelled. They almost always either serve big shopping centres like Highpoint, Northland, Chadstone, Box Hill, Doncaster or high needs, high patronage underserved areas like Greater Dandenong.

It hardly goes without saying that Route 800 on Princes Hwy leads this pack, with it ranking 10th out of over 300 metropolitan routes for Saturday productivity. If you were to prioritise routes to add Sunday service to you'd start with the labelled routes along with others that either don't show due to  lacking Saturday service (eg 802) or are not labelled but have strong social equity cases for a 7 day upgrade (eg 536 and 538 around Broadmeadows). 

Well above the line routes  

The biggest change relative to 2018 is the number of routes well above the diagonal line.

Routes prone to this pattern are those where Sunday service collapses relative to Saturday and which have low income/low car ownership catchments. Prime examples are found in the Footscray / Sunshine / St Albans area involving routes like 406, 408 and 410. These may run every 15-20 minutes on weekdays and Saturdays but collapse to every 40 - 60 minutes on Sundays despite strong all-week demand. The patronage result of this is high crowding on the few Sunday buses that do run.  

However I don't think this is the full story. My judgement is that the shape of the graphed line has changed too much given that bus service levels (and for that matter populations) haven't changed a lot. So another factor may be at play, including ..

Potential data anomalies

The graph showed a similar (if not greater) tendency for a cluster of routes in Melbourne's north to also be above the line. 508 is the stand-out but they also include 555, 556 and numerous others too close to label. At first glance something big appeared to be happening when I compared the 2022 graph with the one I made for the 2018 data.

Unlike the Footscray/Sunshine area routes, whose Sunday service falls off a cliff relative to weekdays and Saturdays, most routes in Melbourne's north had a gentler and sometimes almost no Saturday - Sunday service fall off. For example Wollert and Mernda area routes are typically every 40 minutes off-peak weekdays, Saturdays and Sundays, with operating hours slightly longer on Saturday compared to Sunday.   

My expectation was that if a bus route has a similar number of trips on a Sunday to a Saturday then usage should be fairly similar across the two days, with Sundays a little quieter. But if data shows Sundays dramatically busier than Saturdays then I would query it.

I found 40 routes that had 1.4 times or more the Sunday productivity than they did on Saturdays, mostly in Melbourne's north. This seems extraordinary as Melbourne's traditional working class middle and outer northern suburbs tend to be quieter on Sundays relative to other days than gentrifying inner or lifestyle-oriented bayside or hills suburbs.

Particularly notable was Route 356 in Wollert which had 26 boardings per hour on Sundays versus 13 on Saturday, or a 2:1 difference. Service levels on both days were similar, at every 40 minutes. Other examples were only slightly less extreme. The vast majority (32) of the routes in that top 40 were operated by Dysons. Hence it is possible that there may be an issue with data from particular operators.

Dysons also run the Route 508 discussed above which also appears as an outlier well above the line. However even if it was on the line its high usage would be enough for it to be considered as underserved on weekends, including Sundays. Like 508, data for 555 and 556 indicated high enough Sunday productivity for them to qualify as top 10 routes on a Sunday (despite them being far lower ranked on Saturday). These two (along with others like the 567) are also Dysons, so I'd query data on these too.


Conclusion and implications

Bus usage in late 2022 was still lower than it was pre-pandemic. However of all public transport modes buses are the least exposed to white collar CBD workers, many of whom have continued to work at home for at least some of the week.  

But broad patterns of the productivity data remain unchanged. That is very strong weekday productivity for university and Wyndham area routes. Plus those serving major shopping centres, especially on weekends. 

While I've flagged potential data quality issues for some routes, the patterns are still enduring and robust enough to be able to make a service upgrade priority list with a high confidence of maximising 'bang for buck'. In other words we pretty much know what needs to be done and the costs of doing so are modest where off-peak upgrades are concerned. Thus the main shortfall is not data but political will. 

Commendably some routes that would make a productivity-based priority list (eg 279, 733, 767, 900 & 907) have had some modest service upgrades in the last two years. However attention to many more routes are needed. Notable examples include: 

(i) Better frequency and operating hours for key bus routes in Wyndham
(ii) 7 day service, higher frequency and longer hours for popular routes in Greater Dandenong 
(iii) 7 day service, longer hours and weekend frequency boosts for key shopping centre routes
(iv) 7 day service, longer hours and weekend frequency boosts for inner to middle ring low car ownership areas eg Sunshine, Footscray, Brunswick, Northcote, Box Hill and Clayton. 
 
Examples of a lot of these are in the Top 40 bus service stocktake with a low-budget incremental approach discussed here


Thanks to DTP for the productivity data that made this analysis possible. 


Thursday, July 13, 2023

UN 159: The 5 word secret to faster bus reform in Melbourne


Victoria and Western Australia currently have pretty similar state political conditions. For example both have long-term Labor governments on big majorities riding high in opinion polls. And oppositions are demoralised after recent crushing defeats. 

Both Melbourne and Perth have seen high rates of population growth. Transport policy settings also match with both building major road and rail transport projects. And funding for new service, especially buses, is tight in both jurisdictions.  

A lack of new funding doesn't mean there's nothing to do. Things are continually changing. New data comes in each day. Changes to traffic flow or train times may necessitate changes to bus timetables. And a vigilant transport agency should always be looking for low-budget 'greater good' improvements, like what Melbourne's DoT achieved on the Transdev/Kinetic network in September 2021.

Tending a bus network is much like maintaining a garden. Doing nothing means it gets messy and unappealing with weeds taking over and tending towards entropy. How's Melbourne's bus garden going? Is what's being done enough to keep the weeds at bay? Keep reading and find out. 

Comparing bus service changes 

With similar tight budgetary settings, it's fair to compare achievements of Melbourne versus Perth with regards to bus services and reform of them in the last few years. If one city significantly outperforms the other then we'll be able to establish which has the most effective planning and administration.   

Bus service changes in Melbourne are documented on the PTV website here . The material here goes back almost exactly 2 years (August 2021 - July 2023). This neatly coincides with everything done after the Bus Plan came out in June 2021 so is a fair measure of that plan's impact. Also there would have been nothing gained by going back further due to the disruption caused by the pandemic. 

The last two years of bus service changes isn't as well documented on the Transperth website due to their habit of removing older material from their Planned Service Changes section. However the enthusiast-run Bus Australia forum documents these changes well, with threads devoted to pasting and discussing Transperth service changes in 2021, 2022 and 2023 .

How did I count what got done? Not everything is equal. Moving a bus stop due to road changes or a rebuilt station is minor and shouldn't count as a network reform. Neither might a slight change to a timetable to retain coordination with revised train times. However adding or removing trips is more significant. And network changes like route additions, deletions, alterations or major frequency adjustments are most important of all.

An ideal comparison would weight changes based on importance. However this was overkill for the quick comparison I was after. So I simply counted changes equally, regardless of whether it was minor or major. 

Such equal counting wouldn't matter much if both cities have a roughly similar mix of major and minor changes. I've looked through the changes and am satisfied that Perth's bus service change events are of equal if not larger significance than Melbourne's on average.

Thus if Perth has recorded more bus service change events than Melbourne then it has likely also achieved more bus network reform. This is especially if the difference in activity is so high as to remove any remaining doubt.  

My results are graphed below. 


Note: A 'bus service change event' is defined as anything done to a bus route that is regarded as significant enough by the relevant transport agency to be worth telling the public about. Minor examples include relocated stops due to road changes or revising bus times to meet an altered train timetable. Larger examples could involve new, deleted or modified routes in an area. The graph shows the number of routes involved by month.  

As it happens, the difference could hardly be clearer. In the last 2 years Melbourne had just one month (September 2021) where it had service change events affecting at least 30 routes. In contrast Perth exceeded that threshold nine times, with five occurrences just in the last year. 

Two of Perth's nine big months were triggered by new rail lines or stations but seven were not. The latter indicates Perth's ability to keep reviewing and reforming bus networks without infrastructure triggers or even service kilometre funding top-ups. The cumulative graph below shows that Perth's edge over Melbourne has widened, particularly in the last year. 


The evidence shows that, budget limitations notwithstanding, Perth's Public Transport Authority has a 'no improvement is too small' culture. If they think there's a benefit in adding one or two trips here and there, then they will do it, often to multiple routes at a time.

PTA will also redistribute service between routes if they consider a greater good case exists. In other words what Melbourne did in September 2021 (and rarely since) is everyday 'business as usual' practice for them. The August 2021 extract below shows typical examples (click for better view).   


Perth's 'review and improve' recipe includes adding a few trips each time to a high performing direct route like Route 60. They repeat the process until operating hours and frequency qualify it as a 'high frequency service' with a 900-series route number. This is much like Melbourne SmartBuses except that weekends are not an afterthought, with 15 minute maximum waits, even on Sundays. 

The advertisement below promotes the late 2022 launch of the 980, previously the Route 60 mentioned above. This is not a one-off, with the story of Route 915's creation in 2020, also following several prior incremental service upgrades, told here.


A process of 'business as usual' bus network reform and incremental service upgrades has given Perth an expanding frequent network that now has more routes than our SmartBus. The extent of the latter last expanded in 2010 despite Melbourne adding close to a million people since.   

Bus service change events per capita

Perth has less than half the population of Melbourne. Is it reasonable to consider bus service changes per capita? I believe it is, notwithstanding Melbourne's larger train and tram networks. This is because even inner suburbs need buses to weave trains and trams into a grid network more useful for diverse trips that are not just to and from the CBD. Melbourne's outer growth areas are almost all bus only and many established areas have multi-decade backlogs in bus network reform. 

In total I counted 158 service change events for Melbourne and 564 for Perth over the two years. If we convert that to a per capita number (by dividing by 5.1 and 2.1 millions respectively) we get 31 bus service change events per million population for Melbourne and 269 per million for Perth. The difference is stark:

Perth achieved 9 times more bus changes per capita than Melbourne in the past 2 years. 

Rework just for the last year and the disparity widens. Melbourne achieves 9 service change events per million people compared to 161 for Perth. That's an 18:1 difference in Perth's favour.

It's true that Melbourne still did good things with bus services in the last year, with the 2022 state budget helping. And May 2023 was the most active month since September 2021. However the pace of reform has still slowed relative to Perth. What  takes Perth a month requires at least a year for Melbourne to do. 

Melbourne's inability to move quickly on bus network reform (or even modest timetable optimising) is like a golf course groundskeeper who can only tend one square metre of ground per day. They're doing something but it's not enough to stop the weeds encroaching.

Similarly our bus network, the only public transport near most Melburnians, is tending towards entropy. We are accumulating a lot of poor performing routes and are only rarely giving high performing and/or high needs area routes the service they deserve. I discussed what to do about poor performing routes here and identified high needs routes worthy of a service boost here.   

Finding

Ben Carroll as minister and Paul Younis as Secretary are presiding over a Department of Transport and Planning that finds itself unable to implement even modest bus service changes at a reasonable work rate, Bus Plan notwithstanding. 

This is denying millions of Melburnians the public transport service they need and taxpayers value for money from the bus network. A big opportunity exists for DTP to pick up its bus game to a pace that its counterparts elsewhere have shown is attainable, even in a tight budgetary environment.  


The secret

This leaves us with the five word secret that DTP in Melbourne need to know if it wants to speed per capita bus reform to match current Australian best practice. That is in relation to almost everything to do with buses, DTP must: 

Drop everything and copy Perth


Perth has shown that even if it gets no or little funding for extra annual service kilometres, they have the will and capacity to  review usage and service levels, with numerous small additions and deletions along with a progressive expansion of their frequent network. We could do worse than to follow suit, especially to copy their 'no improvement is too small' policy.


Index to other Useful Network items here


Appendix - Melbourne's bus service change events in the last two years

* 26 June 2023: 863 extended, 895 rerouted/simplified
* 28 May 2023: 343, 356, 357, 358, 381, 382, 383, 384, 385, 386, 387, 388, 389, 564, 569, 577, 578, 579, 580 582 recoordination with trains
* 30 April 2023: 733 & 767 major frequency boosts. Minor route and timetable changes for 200, 305, 309, 907. 
* 12 February 2023: Route 505 extra trips added
30 January 2023: 624 minor deviation added to serve school
* 11 Dec 2022: 828, 831, 834, 835, 836, 837, 838, 839, 847, 888, 889 and 899 will now operate from the new bus interchange on the southern side of Berwick Station. Bus Route 846 has minor route changes around new interchange
* 31 October, 2022: 235 & 237 major frequency boost (to every 10 min)
* 23 October, 2022: Tarneit North FlexiRide starts
* 28 August 2022: 897 & 898 routes extended 
* 7 August, 2022: Route 390 frequency boosted
* 3 July 2022: 513, 534, 536 and 951 minor route change near interchange. 514 created to simplify  complex 513.  
* 26 June 2022: 153 & 498 minor route change for new interchange & 182 rerouted for road change. Also 152, 160, 161, 166, 167, 170, 181, 192 minor timetable change for recoordination with trains.
* 24 April 2022: 706, 857, 858 and 902 minor route change for new interchange at Chelsea. 530, 531, 532, 544 minor timetable changes. 528, 529, 533, 537 major frequency and span boosts and route reforms in revised Craigieburn network. 
* 11 April 2022: Route 511 minor route change due to road change.
* 21 February 2022: FlexiRide Rosebud starts, 787 route simplification and new timetable
* 20 February 2022: 781 major extension, 887 major extension and service boost
* 31 January 2022: 626 minor deviation added and timetable change
* 30 January 2022: New route 881, deleted route 673. 683 684, 685 get minor timetable changes for recoordination.
* 12 December 2021: Melton FlexiRide started
* 28 November 2021: New 816, deleted 815, major timetable upgrade 813 in Keysborough mini-review. Timetable upgrade for Route 525.
* 14 November 2021: 788 major timetable upgrade
* 31 October 2021: New 390 route starts
* 4 October 2021: 381 minor timetable change with extra trips. FlexiRides replace Telebus in Lilydale area, Route 672 run constant direct route. 
* 24 September 2021: Night Network reforms 21 regular routes gain improved hours major timetable upgrade and reforms to services on 13 night only routes. 
* 20 September 2021: New 202 route commences, minor timetable change to 546. Timetable reforms to 19 Transdev routes, with 10 major improvements overall, 4 overall losses and minor changes to 5. More here
* 19 August 2021: 511 and 525 get minor rerouting to connect to trains at Donnybrook. 

Thursday, July 06, 2023

IV's Bus Reform Community Research


Part of me thinks it's good that different parts of state government are talking about bus network reform and care enough to do research on it.

Another part of me thinks it's wasteful duplication, especially given that (a) both DTP and IV have been doing pretty similar activities (ie market research) on bus reform and (b) that it's all pretty academic given there's basically no state budget funding to do it.

As a rough simplification the Department of Transport and Planning (DTP) does stuff while Infrastructure Victoria (IV) is advisory. You might say that the government listens more to DTP than IV. However (unlike the big infrastructure construction authorities) DTP has a more subdued media and public image, with IV more active in media and public debate.

What recent work has DTP and IV done regarding bus reform? Here's a summary before I discuss what IV have most recently released. 

DTP

DoT's revived interest in bus network reform became public in June 2021 when the Bus Plan came out. Shortly after there were some small but worthwhile bus network reforms.

DoT then announced bus network reviews for a large slice of north and north-east Melbourne in September 2022. The review area goes from inner to middle to outer suburbs, with diverse demographics so could be considered reasonably representative of Melbourne. Over 3500 people took part in consultations in these areas (plus Mildura), though being opt-in and online the results won't be completely representative.

Questions included the trip purpose people used buses for, the times of day people travelled and the attributes people valued in a bus service (eg frequency, reliability and connectivity). There was also a lot of teasing out peoples' views on whether they would walk further to a bus that ran more frequently, or would accept changing between buses if it was possible to run routes more frequently. Questions were posed several ways. It seemed to me that they were skewed to win legitimacy for the department's preferred new approach to bus network planning and reform (ie having fewer but more direct and frequent routes).  

Read this for yourself in the consultation summaries published for each area here

IV


IV's 30 year strategy flagged bus network reform as being important. In December 2022, a little after the previous month's state election, IV released its own bus reform discussion paper which I reviewed here. The 'Get on Board' paper had a lot of good stuff analysing the current network and its issues. Many of those themes reflect what was in Victoria's Bus Plan that DoT released about 18 months previously.

Get on Board's
 two main weaknesses were (a) its misplaced faith in flexible route buses (that are neither productive nor efficient compared to fixed routes) and (b) their economists obsession with pricing over product, most corrosively in their backing of modal fares (that actually undermine efficient multimode networks where modes connect rather than duplicate). 

However the release of IV's paper led to media coverage and discussion on the role of buses. This was a good thing given that government support for upgraded and reform buses in the way that it counts (ie through its budget) is minimal, putting the service aspects of Bus Plan in a critical condition.  

Key DoT/DTP and IV developments regarding bus network reform are summarised below: 


IV's Bus Reform Community Research

This is the latest work to come out. Background on it here. Done by a commissioned market research company (Quantum Research), IV describe it as: one of the largest ever studies of current community perspectives on Melbourne’s bus network.

And it's true it does go into a lot of detail. Possibly too much. Because with this stuff you get to a point where once the basics are known anything further is gilding the lily and represents poor value for money. That's especially if (a) we already have bus reform examples to draw on including knowledge of what works and what doesn't, (b) it's research ground that others have covered before and (c) there's no significant funding to act on the research. 

Having said that we're always curious so it's still worth at least a flick through the report's 119 pages. It's dated March 2023, meaning it was finalised before the results came out from DoT/DTP bus review surveys. As you can see from the time-line above, the gestation period for the latter was unusually long (8 months). It is possible that there might have been some DTP/IV collaboration or at least cross-pollination. 

Let's look at the survey mechanics. The survey work ended in December 2022. It involved 4000 interviews. Pages 106 and 107 compare the representativeness of the survey sample with ABS population numbers. It was mostly representative except for a mismatch with regards to low income earners. For example ABS had 14% of households in 2021 with less than $26000 income versus the survey sample of 5% on less than $25000. Even noting the difference in incomes, this really under-represents lower income earners. This is significant as other parts of the survey indicate distinctive answers from this group with regards to bus usage. The unemployed were also under represented (2% vs 4%) but full-time workers were somewhat over-represented. Hopefully suitable weighting has been applied here. 

Pages 106 and 107 did not mention how ethnically/linguistically representative the survey sample was.  Whether one was from a culturally or linguistically diverse background had a significant bearing on some results, including propensity to ride buses frequently.

Things worth knowing

Frequent bus users are not that representative of the general Melbourne population. 16% of respondents used the bus at least weekly. The groups with the highest usage included those without car access (36%), 18-34s (25%) and those from a culturally or linguistically diverse background (24%). In other words roughly twice, 1.5 and 1.5 times likely respectively. Those who never used the bus accounted for 34%, with retirees and those in growth areas being about 10% above that. 

3 in 5 knew where their local bus stop went with only 1 in 5 knew where buses went. This gap could be a result of non-usage along with limited information and complex routes. Three quarters of people were within a 10 min walk of their nearest bus stop. 

Safety at night was a major theme, the latter especially amongst women. Those in growth areas and over 65 were also very concerned about this. This can have an effect on network design, especially the types of networks that force a lot of interchanging, such as the DTP survey led people to favouring. 

Many were willing to walk a bit further to a more frequent service. Bus users (unexpectedly) were happy to have more bus lanes for faster travel. There was more support for buses being removed from some streets if there was a flexible route service to replace it than if people were left with nothing. However flexible route buses are the sort of thing that sounds good but are both unreliable and have low productivity per passenger carried. It would be interesting if results would change if people were told these facts about them. 

Most respondents (70%) replied they couldn't survive without a car but a significant minority (25%) said they would like to get rid of their car if there was a viable alternative. So a car is thought as a necessary evil amongst some. But the view of buses isn't particularly high either, as later results reveal. Still it's possible for both perspectives to be prevalent and for buses to have a greater role than now. 

The choice model survey

Much of the survey consisted of people choosing between various options to make various trade-offs. For instance operating hours, frequencies, walking times to the stop and many others. Some options hardly exist now, eg 5 min frequencies. Others are unusual eg a given number of minutes early is equally weighted as that same number of minutes late when in real life earliness is far less accepted and tolerated. This asymmetry is why the industry has measures like 'no more than 5 min late or 60 seconds early'. 

For some reason the fare was always included in all options, which IV admits inflates its importance in the graph below. (click for a better view)

The steeper the line the more pronounced the influence. Below shows page 58 with the more influential factors according to the survey. Note the steepness of fares. Except potentially for short trips other passenger surveys I've seen tend to accord service-related factors like frequency and operating hours as being more important. Those not listed below (eg reliability and operating hours) were considered less important. And recall from before that the sample undercounts lower income people, so there might be representativeness issues. (click for a better view)


Also if you want to appeal to the 25% of people who may be open to not owning a car, then you do need wide bus operating hours. Even if such people don't use late night buses much, not owning a car is a strong factor that encourages peoples high bus usage at other times of the day. And the marginal cost of adding evening service is lower than (say) adding peak service. Therefore I would be wary about using this data as justification for cutting service levels at certain times unless there were some very strong 'greater good' reasons to do so. 

Something that came out strongly in the results is whether people would change to a connecting bus. This just had two 'required / not required' answers, with nearly everyone opting for the latter.

Yes we would all love a bus to our door. And if there wasn't then at least incredibly frequent services, eg every 5 minutes, that hardly exist on the network now.  Which by the way was the answer given to people in the survey, even if the frequency they were starting off with was a rather poor 30 or 60 minutes.

This hostility to changing buses is a different view to what some of the more radical bus reform advocates in DTP and academia would have preferred, and which came through in the former's survey. Answers might have been different if there a third option, eg a coordinated timed same-stop transfer for popular travel options, offered.

The responses here show the limitations of trying to design a bus network by opinion poll, that some trade-offs need to be made and you can't please everyone.  Transfer issues are only exacerbated if you include flexible route buses, due to their unreliability and ability to cover only a small area (unlike a long straight fixed route which at least can intersect with multiple routes, making many trips possible with just one change).  

In contrast to the negative reaction regarding transfers, if people were able to get the bus that went to their destination then they would be willing to walk further to catch it, especially if travel was overall quicker or there was higher frequency. The starting assumptions were 30 min frequencies on weekdays and 45 minutes on weekdays which isn't always representative of buses where survey respondents live. 

The survey includes a look at how different passenger groups responded to factors like service hours. As would be expected, inner city work commuters were least sensitive (possibly as many work in the CBD, often have trains and trams and mainly work M-F 9-5). Students in the western region were most responsive to increased weekend frequencies - possibly because of high needs, less rail infrastructure and relatively infrequent service existing. 

How much will you pay?

The IV survey was big in asking what people were willing to pay for (with the potential implication being that something is worthless if people don't tell a survey that they will pay for it). Survey respondents said they weren't very willing to pay for longer operating hours. They were somewhat more willing to pay for boosted frequencies on weekdays versus weekends, with their answers giving specific monetary values (ie a capacity to pay measure which would likely be wealth dependent).

Some of this might be influenced by existing services. Eg many outer areas have fairly low frequencies on both weekdays and weekends whereas parts of the inner west have good Saturday frequencies but poor Sunday frequencies. Other areas have fairly similar Saturday and Sunday frequencies but both are about 50% of that which runs on weekdays. 

I'm not sure about this approach. Having less money, the low income and unemployed respondents would be most unlikely to say they will pay much more for increased service on a per trip basis. 

What if you asked survey respondents whether they would ride the buses more if they ran longer hours or better frequencies? Here you might get more yesses. And they would likely contribute to more fare revenue to the system. So people would be paying more for PT per month because they are using and benefiting from it more, even if they answered no to a willingness to pay question. Plus there can be significant savings where improved public transport means that even a small number of taxi or uber trips can be avoided. 

Conclusion

IV has presented some substantial market research on bus reform.

Some of it rings a caution bell on matters like passengers willingness to transfer that might moderate the hubris of some. That's not necessarily a bad thing, with it important to heed lessons from Adelaide's failed bus reform attempt a few years ago. 

However it's also not a good idea to slavishly use its findings to avoid reform as you might not get a network much better than what we have now. For example you might have cheap modal fares, still mediocre service hours, slightly longer walks but still poor frequencies as there would still be lots of routes still needed to avoid transfers. And, due to that resistance to changing, along with cheaper bus-only fares, potentially also buses closely duplicating trains. In other words, especially if flexible route buses are part of the mix, a still inefficient and underperforming network. 

Sometimes you've got to ask people if that's what they really want, rather than relying too heavily on a survey, which doesn't necessarily explain all implications of choices made. 

Those seeking more information can watch a webinar on Tuesday 18 July. In the meantime please feel free to leave your thoughts in the comments below. 

Saturday, July 01, 2023

40 years since The Met (Was it any good?)

Today marks 40 years since transport was organisationally reformed in Melbourne. Metropolitan train, tram and government bus operations were united under the Metropolitan Transit Authority from July 1, 1983. This was one of four new transport authorities set up by the Cain government. 


These reforms could be seen as a continuation of the trend towards ministerial control of the transport network. While transport and politics had always been intertwined, declining patronage and rising costs meant that fares could no longer fund operations (let alone capital improvements) and services required government subsidy after about 1970. 

State funding always comes with strings attached. In this case it was a desire for political control (in the name of things like 'the public interest', 'accountability' and 'efficiency' or less stated political ends like looking after marginal seats). Associated organisational changes can affect the relative profile and power of various people within the transport hierarchy. 

Hence, much like how police commissioners are household names, 60 years ago everyone knew who Robert Risson (Tramways Board Chairman) was. Whereas in 2023 few can name DTP's Secretary (Paul Younis), Metro CEO (Raymond O'Flaherty) and Yarra CEO (Carla Purcell), but Transport minister Jacinta Allan is recognised by all. Back in 1982-83 incoming minister Steve Crabb sought a similarly high profile as a big-promising 'Mr Fix it' with organisational changes reducing the autonomy of the old modally-based rail and tram bodies. 

The appetite for change in 1982 was high due to transport's then poor state. While there was a revival of government interest in public transport in the first half of premier Hamer's time (including the arrival of Hitachi trains, new trams and City Loop construction) this gave way to a decline after about 1978 (including strikes, service cuts, line closures and the unpopular Lonie Report). Network patronage was also falling, hitting rock-bottom around 1981.

A public backlash to the Lonie report (which wanted to cut basically all regional rail) and an election looming led the Hamer/Thompson government to change tack in 1981. That year's New Deal for Country Passengers started the reversal of fortunes on the busier regional lines and there were some bus upgrades in 1982 (interestingly the exact same recipe for Steve Bracks/Peter Batchelor with other modes neglected).  The public did not seem convinced by the 27-year old government's latter-day conversion. Public transport was still a big negative for the Liberals with John Cain's Labor opposition promising a big revival.  

The new Cain government, with Steve Crabb as Transport Minister, introduced the Transport Act 1983. This was transport reform's enabling legislation. More about it and further subsequent restructuring  here


Industrial relations

As everyone was only too well aware, industrial relations could make or break public transport. Even someone being rude in the lunch room could stop the trains. While older Melburnians romanticise tram conductors and pre-privatisation Met-era trains, the truth is that service was pretty mediocre in the 1980s with cancellations higher than now. Much was due to industrial disputation with accounts of disruptions published in PTUA newsletters of the time

Unions in those days were not just after pay and conditions but also wanted a big say in how things were done. This 'Me and The Met' video shows how management (led by American Lynn Strouse) sold organisational and other change to its workers. 

As a former managing director of Hertz Rent-a-car, Strouse brought transport (but not public transport) experience to the MTA managing director role. He didn't last long, resigning in 1985. The same could be said for his successor Mr K Shea from the Road Traffic Authority. These appointments may indicate a dissatisfaction by government with existing railway or tramway managers, with a preference for leaders with automotive or roads backgrounds.  


Fares


In theory The Met was multimode, even if operations were mostly still not.

Achievements in multimodality included unified livery, improved passenger information and a new neighbourhood-based fare system. That continued the multimode principle of the previous concentric three zone TravelCard system with time-based tickets allowing free transfers. However neighbourhood fares made Melbourne a patchwork of fare zones with numerous ticket combinations. All it did was to add complexity for little extra revenue as relatively few people made long orbital trips. Hence in 1989 Melbourne reverted to three radial zones but with slightly different boundaries to what operated under TravelCard. The popular time-based feature with free transfers (which contributed to increased usage on all modes) was retained. 

Subsequent fare changes in the 2000s, 2010s and 2020s made fares almost independent of distance, firstly across Melbourne and then across the state. These were all done because politicians see greater returns from cutting fares than boosting service. However the almost flat fare system makes it possible to simultaneously (and reasonably) complain that very short trips cost too much while long distance travel is outrageously cheap. 


Controversy and achievements

The Met era was not free of controversy. Plans to convert railway lines to St Kilda, Port Melbourne and Upfield to trams (or 'light rail') faced opposition, and in Upfield's case was not carried out. Few of Labor's bold 1982 promises to build or extend lines were honoured though some lines (eg Stony Point) were reopened.

Some of what was done was a case of 'two steps forward, two steps back', for instance the routing of previously fast Werribee trains via the slow Altona section when the line to Laverton was completed. Werribee people had to wait decades for their all-day direct service to be restored, though this has only been partial, with weekend and evening services continuing to operate the slow way via Altona in 2023. 


The Met period is also associated with the full completion of the City Loop, the roll-out of A and B class trams and delivery of air conditioned Comeng trains. The latter is significant as air conditioning  went from being a rare luxury to a standard feature in private cars during the 1980s and 90s. There were also some rail infrastructure upgrades such as overhead renewals and Frankston line's third track to Moorabbin which allowed more expressing. 

Train services

Trains were largely considered peak commuter transit. There wasn't much interest in increasing off-peak service frequencies (nor even of reversing the 1978 cuts to evening frequencies).

At this time the typical Melbourne train line ran every 20 minutes Monday - Saturday off-peak, every 30 minutes Monday - Saturday evening and every 40 minutes on Sunday (with a later start and earlier finish than on other days of the week).

Met-era train frequencies compared poorly with what Perth was rolling out in its early 1990s electrification with their weekday interpeak frequencies improving to every 15 minutes (which later got extended to 7 days and into the early evening).    

Trams generally were more frequent but remained with less service than 30 years prior


Multi-mode planning

With the railways running their evening trains typically every 30 minutes (after the 1978 cuts) and the tramways preferring 20 minute evening frequencies, there was no timetable co-ordination between modes in pre-Met times, with the best connections recurring only hourly.

Despite the organisational changes and the rhetoric, The Met didn't walk the walk when it came to the nuts and bolts of service planning, especially across modes. This is unlike what Perth was doing in the early 1990s when it was designing its feeder bus network to harmonise with the new Joondalup line.

The Met experience shows that although you can have on-paper unification modes will continue to operate as separate fiefdoms unless there is a determination to bring a network perspective to service planning and harmonise timetables. Some opportunities to weave a network were taken but too many were missed during The Met era, such as short tram extension where they stopped short of stations. 

Box Hill was The Met's showpiece when it came to physically integrating train and bus connectivity. It was good for those getting to the shops but weaker for connectivity between modes. With the trains at the bottom and buses three flights of stairs above (with a shopping centre in the middle) it did not make for the fast and direct interchange that such a major transfer point ought to have. Other states were doing better at the time, having recently built efficient train-bus interchanges at locations such as Sydney's Bondi Junction, Adelaide's Noarlunga and Perth's Kelmscott. 


Bus planning

Melbourne's two-tier bus network continued through the Met era. For example main routes inherited from the Tramways ran frequently over wide tram-type operating hours. Whereas privately operated routes rarely operated on Sundays or even Saturday afternoons. Despite operating hours improvements since, stark differences in service levels, even on routes that ought to be comparable, remain to this day.    

The mid-1980s saw reviews of bus networks in areas like Moorabbin. There was still a large number of short routes but small private bus operators were gradually merging or being bought by large operators. 

Older areas (often losing population) had bus routes very closely spaced while growth areas lacked service. Bus resources tended to be shifted to growth areas with inner area frequencies reduced. Some people gained but in other cases buses became a less attractive 'last mile' option for commuters beyond walking distance of a station.

Trading hours were widening with Saturday afternoon shopping, especially at major centres, becoming more common. Buses then often ran a frequent Saturday morning service but ceased operating after midday. 1987 bus timetable changes added Saturday afternoon service to many bus routes as well as some later evening trips. This was a major upgrade program, benefiting 85 bus routes (out of a 250-300 network total). You could say it was a precursor to the 2006 Meeting Our Transport Challenges plan which implemented even better upgrades on more routes. 

The rise

V/Line was doing well while Melburnians loved their new air conditioned trains as Red Rattlers became rarer and rarer. Trams extended further north while growth areas gained new bus routes. Patronage across all modes revived from its 1981 nadir as unemployment fell from 1984. There did seem to be some feeling of progress. Confidence peaked in 1988 with minister Kennan writing an optimistic introduction to that year's Met Plan (more on that here). He said that the 'atmosphere of decline and decay' was over and the only way was up. 

The fall

That MetPlan introduction proved to be the hubris before the fall. That fall was fast, hard and long. So long that almost none of MetPlan got done in its 15 year term and service actually went backwards.

Victoria was the hardest hit state of the 1990s recession as manufacturing industries closed and people left for Queensland. Unemployment surged and state finances were parlous due to the VEDC and Pyramid scandals and reduced revenue generally. Affiliated unions (including in transport) would not accept cuts proposed by the Labor government. The government sold and leased back trains and trams to pay its bills. Decline and decay were back. Big time. 

Not all transport problems were related to or started when the state's economy soured.  

For example political and industrial relations between the publicly moderate Cain government and the broader militant left-wing movement had long been toxic. There were times where ministers appeared like ineffectual teachers facing a rowdy classroom. Controversies existed over the Upfield line's future, numerous strikes, ticketing and staffing issues. Background on some of this activism here.

What might  have been seen as public transport's ungovernability could have made ministers throw up their hands in despair and warm to the (mostly incorrect) hope that franchising out operations would transfer risk and responsibility to others. This may have been one reason why Victoria was more eager than other states to franchise out trains and trams even though it didn't necessarily end up saving much money.  

The MTA was also its own worst enemy with regards to bus contracting in 1988. Mis-steps led to protracted litigation (the Waverley Transit case) that private operators won. This resulted in the government paying Quinces to start running long highly duplicative routes across the eastern suburbs (631 and 634) at short notice. These were called 'Metlink' routes but they had little in common with the more direct 'Metlink' routes in MetPlan that were more like the orbital SmartBuses we eventually got about 20 years later.

During this time transport went through another organisational restructure, with the MTA and STA merging to become the Public Transport Corporation (PTC). In 1990 and 1991 PTC cut funding to private bus operators. This resulted in massive cuts to peak, after 7pm and weekend buses across Melbourne. That effectively undid a lot of the 1987 upgrades if not more. Timetables were not to recover for another 20 years if they did at all. An example of the latter was the 800 bus along Princes Hwy between Dandenong and Chadstone. This saw all Sunday, all evening and most Saturday trips cut in 1991. Despite high usage and development since, the reduced timetable remains, almost unaltered, in 2023. 

Most famously was Jim Kennan's 'scratch tickets' debacle that made paying fares optional as the government sought to remove tram conductors. Industrial disputes clogged the city with trams while surging cancellations made catching trains a gamble. A Kennan vs Mees (PTUA) debate appears here: 


Staffing at stations was being reduced, especially outside peaks. Evening train usage was so low that sometimes only the front carriage was open for passengers. There was a vandalism and graffiti epidemic with concerns about personal safety rife. TISM's Mourningtown Ride was one product of this era.  


By 1991 public transport in Melbourne was at a low ebb, like it was a decade earlier. Many patronage gains were lost as train, tram and bus service deteriorated. While raw usage was still higher in 1991 than it was in 1981, modal share was at a record low as population had grown. 


(Direct YouTube link if video above doesn't show - 1989-90 news reports)

Politics and aftermath

Around this time having political responsibility for public transport was a poisoned chalice. This is especially under a Labor government where there were unmeetable expectations from unions and, to some extent, the public (which Labor itself fanned though promises made). Transport ministers in this era tended not to last for long. For instance the 10 year Cain-Kirner period saw 4 ministers (Crabb, Roper, Kennan, Spyker). Only Crabb and Spyker remain alive today with Roper's state funeral in a few days. 

Labor lost the 1992 election with the state still deep in recession. Some regional lines were closed under Jeff Kennett. There was also the threat of metropolitan closures and permanent evening bus replacements but these were staved off.

Minister Alan Brown presided over a major cost-cutting program that was easier for a Liberal government to do as the premier and minister could be firm with unions without threatening factional relationships and thus their positions. Brown, possibly the most competent transport minister for many years, almost comes across as a hero figure in wanting to retain and extend trams at a time Alan Reiher, the state's top transport bureaucrat, wanted to close them. Mooted severe cuts for the metropolitan rail network were avoided. However ticketing was to remain a problem for this and successor governments with Metcard costing more and taking longer than envisaged.

Staffing numbers were cut but the loss of services in transport was perhaps not as severe as that more wider occurring school and hospital closures. By about 1997 things had settled down with fewer cancellations, the Upfield line saved and interpeak train frequency increases on lines in the south-east. Trams that ran as buses on Sundays got 7 day service restored and NightRider buses started. Possibly parliament's longest ever speech on public transport was given by Robin Cooper in 1996 detailing that government's achievements. 

Just before it left office the Kennett government introduced the biggest ever increase in Sunday service increases across the train and tram networks. Over 20 years later the current government has yet to implement any across-the-network metropolitan service increase of comparable size. 

Those upgrades were for trains and trams. But bus services were largely neglected during the Kennett era. 1990s growth areas like Rowville and Lysterfield didn't even get a basic hourly local bus service, with their situation remaining basically unchanged 30 years later. Some existing routes got reduced service but the cuts were not as deep as in the previous two years under Labor.   

Met buses got franchised (ie privatised) in two tranches with National Bus and Melbourne Bus Link taking over in 1993 and 1998 respectively. Trams and trains followed later. The latter was operationally disruptive as the government unwisely sought to split one train network into two in an effort to play operators against one another. (as is received competition theory). The incoming private operators ran reliable services  between 2000 and 2003 but hoped for cost savings did not happen, having bid too low. More on that era here

As you might  have gathered, late 1990s transport policy was all about transport franchising. That is, as a Marxist would say, the means of production rather than the product or service itself. The Met's dismantling was overseen by a 'Transport Reform Unit' in Treasury that, like early 20th century railway moguls, saw modes and operators as competitors against one another rather than as part of a connected network. Hence aspects of multimodalism, such as common signage, liveries and multimode maps, that were achieved under The Met were removed (or left to rot) as the new structures simply had no one properly responsible (The then Department of Infrastructure at the time being notoriously lazy on this).


Under franchising there was just one government job in transport, and that was to manage a series of private contracts that periodically get retendered. The assumption that this could transfer political risk proved incorrect, as the Brumby government found. As did the one about having franchisees independently plan acceptable networks as we saw in 2015 with Transdev.

Similar ideologies survive today in the more doctrinaire corners of Infrastructure Victoria who believes that public transport modes should compete rather than connect, aided by differential modal fares that undermine efficient network planning (including the bus network reform that IV otherwise purports to back). 

At the worst depths of this lunacy we saw trains and stations with maps showing only 'their' half of the network (ie Bayside or Hillside). And there was the farce of trains continually being rebranded at the drop of a hat. The network became less legible with information either fragmented or falling to pieces.

Deluded operators thought that there were heaps of potential cost savings there for the taking and if you rebranded a train patronage would rise to meet the levels their ambitious bids were based on. Neither happened and operators made penny-pinching short-cuts (eg National Express not training new drivers).

In the first clue that they had to think like a passenger and see the network as a whole, panicking private operators got together to form the Metropolitan Passenger Growth Initiative. This would become Metlink (technically an operator owned company) and provide multimodal passenger information and network marketing. This period coincided with rising patronage driven by booming CBD employment, higher fuel costs and bus service upgrades associated with 2006's MOTC plan. 

In short Metlink did some of the functions that The Met used to have, except for network planning, managing contracts and direct operation of services. The transfer of planning and operator contract management was to be a matter for another time and another government with this achieved when PTV was created in 2012 (under the Coalition).  


Conclusion

This has been my look at The Metropolitan Transport Authority. It might be a shock to realise that today on its 40th birthday we are further from July 1, 1983 than that date was from the Normandy landing in 1944. 

The lukewarm view above may surprise some so I'm going to explain further. Though less so now (as older generations died and we gained newcomers from interstate or overseas) there used to be a 'rose coloured glasses' sentimentality about pre-privatisation public transport in Victoria, especially around matters like tram conductors, station staffing and even service delivery. 

On the latter, objective data often takes second place to perception. There still seems to be a body of sentiment that regards V/Line service as superior to Metro train service. This is even though the former cancels a higher proportion of its trains, has had a sustained deterioration in operational performance and, due to generally lower frequency, imposes longer waits if your train doesn't run.   

People in every city readily claim their own as an exception in everything from peoples' sloppy driving habits to bad transport service. But I do think Melbourne genuinely has (or had) a fair claim to exceptionalism in how sentimentally it views its public transport past (even amongst people you'd think would be too young to remember). Unfortunately such sentimentality can cloud judgement over what is good and bad.  

Ranking the large Australian cities on this, Perth would be at the other extreme, almost completely lacking nostalgia. This is because only the 70+ remember its trams and its network truly was limited before the transformative rail and bus upgrades from the 1990s. Almost no one there would want to retreat to the time before then. And the enthusiast movement who might perpetuate old myths appears very small there.

Sydney and Brisbane occupy a middle ground between Perth and Melbourne. Both cities had more 1990s/2000s transport projects happening than Melbourne, and Brisbane's suburban rail electrification was relatively new. However some of their regional areas (eg NSW north coast) may still be smarting from rail cuts and more people alive remember Brisbane trams than they would trams in Perth. Adelaide's sentimentality would likely be more like Melbourne's due to an older population and a network that's progressed far less than Perth's.     

You can count multimodal fares as a major and enduring Met strength. Despite the misguided dalliance with complex neighbourhood fares, what it did achieve was so strongly accepted that late 1990s attempts by private operators to fragment fares did not last for long and were (wisely) pulled back under the Bracks/Brumby government. This gave Melbourne an edge over Sydney and Brisbane who had fragmented modal fares. 

Other Met achievements (like the unified branding and information) were discarded too quickly in the name of political trickery and operator egoism. Fortunately stability on branding seems to have been restored after the silliness from the late '90s. However it took years (through Metlink and PTV) to get back what franchising took away from us in terms of information and a workable institutional structure for network planning.  And the threat of restructuring that could lose gains that have been won is never far away. 

On the debit side, service delivery wasn't great. And the five years it took for MetPlan to come out was too long. Had Met Plan came out in say 1985 it might have been possible to lock in more of it before the money and political interest ran out. This may turn out to be a major lesson for Victoria's Bus Plan whose health on the service aspects is not the best at the moment (partly as a. it took a long time for the current government to release a bus plan and b. the 2021 plan that did come out was essentially a 'plan for a plan' without substantive service measures proposed). 

To summarise, some good thing did happen under The Met. But at many times services under it were not particularly good, reliable nor efficient, even when compared with what was happening at a similar time elsewhere in Australia. It was also weak in multimodal network planning and coordination. Hence the short answer to the question posed is no.