
Let's take a break from looking at timetables to their adherence. After all whether your service is punctual or even shows up at all is an important part of passenger experience.
For at least two decades passengers could check monthly performance for trains and trams. Indeed there had to be posters on the system reporting it each month. This is tied to a contractual operational performance regime which fines operators and pays compensation to passengers (as travel credits) if delivery and punctuality fall short.
Passenger compensation arrangements
The main game should be running a reliable service rather than the minutiae of compensation. Still it's worth spending a moment to consider who can get it. The answer is that arrangements are imperfect and favour the private operator, eg passengers must formally apply rather than get an automatic myki credit.
Also the archaic 28 day pass or longer rule makes few eligible, especially now with widespread working from home and less regular commuting. But even before the pandemic compensation didn't go to those most affected. This is because compensation was available to higher income full time white collar CBD earners more likely to use periodical tickets (ie myki pass at least 28 days long). In contrast it was less available to lower income casual workers who are more likely to use myki 7 day pass or myki money, neither of which offer compensation entitlements. This is despite, due to their weaker position in the labour market, those in the latter group being more likely to lose pay or even their job if trains are consistently late or cancelled.
No compensation arrangements apply for bus passengers. For years the only bus performance statistic appeared in the government's budget documents. This might show suspiciously high service delivery (like 99%) even though individual experiences with particular routes could vary greatly. In July 2021 the state government addressed this issue with per route bus performance data now being made available.
What about when service gets really bad and disruptions are both network-wide and hit the headlines? Then the government may declare a free travel day open to everyone. It's been a while since we've had one in Victoria. However Sydney's recent major rail disruptions has led to them offering 12 days free travel as compensation in April 2022 (coinciding with school holidays).
Where do you find performance data?
The short answer is that it's on the PTV website. The long answer is that it's more complicated. There's a lot of information but you need to be a bit of a data wonk to use it. And some PTV website links that should work have been broken for months. But once you find a working link you could be enjoying this data for hours. Let's dive in.
Data is presented via an interactive thing called PowerBI Dashboard. My first attempt to find it failed with the search ending in a broken link.
This bug has existed for months (at least). Its longevity may indicate that DoT people (especially contract managers) don't use their website's performance reporting tools as much as they should as otherwise they'd see such errors. Or they do but there aren't good internal systems or cultures for identifying, reporting and correcting errors quickly. Either way the DoT could take a tip from the IT industry on the product quality benefits of dogfooding their public-facing work.

To properly find Power BI do the following to get a working link.
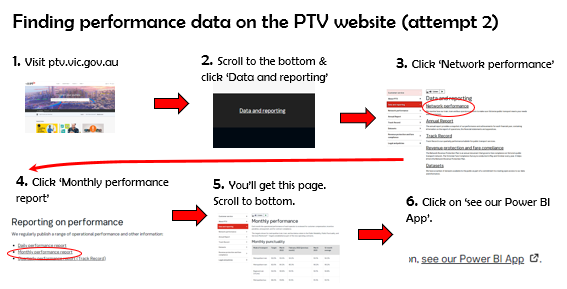
Click here for a short-cut to Step 5. Success looks like the following entry page.


V/Line has gone through a rough trot lately. If a Metro train is cancelled the next is normally within 20 or 30 minutes. Whereas V/Line waits are double or more that. They're only required to run 96% of their trains (versus 98.5% for Metro) but they routinely fail even that.

In September 2021 V/Line had a major COVID-related driver availability crisis explaining the big drop in that month. However the regional operator's woes started well before that. You can see that if you set the months window to 240 so that you see 20 years of data. Around 2003 it was not uncommon for V/Line to run 99.5% of its trains. That is just one in 200 services were cancelled.
The gap between 100% and actual delivery has been widening ever since. It's true that there have been significant growth pressures with V/Line becoming largely an outer suburban rail operator with the rise of stations like Tarneit (which didn't exist before 2015). But even as recently as 2017 V/Line could meet its (not particularly tight) 96% delivery target in most months. Since then it's been rare for it to have a good month.
V/Line's punctuality target is 92%. This was routinely exceeded before everything fell off a cliff in 2003 (Connex had similar problems then). Lockdowns and local travel restrictions allowed V/Line to reach 92% for the first time in years during the pandemic. Unlike service delivery V/Line's punctuality remains relatively high today with 93.1% recorded as late as February 2022 before dropping to 90.6% in March.
As I wrote last week, performance reform in V/Line is sorely needed if we are to successfully deliver transport for the largely regionally-based Commonwealth Games in 2026.
Metropolitan bus
Unlike the other modes there are three lines. The lines near the top are described as journeys allocated and journeys monitored. They average 99.9 and 99% respectively. The solid line shows punctuality over the last 30 months. Buses like trams are subject to delays due to road traffic volumes. You can see the broad trend where punctuality was highest when there were few cars on the road while we were locked down.

More than other modes, the data presented is an aggregate of hundreds of different stories. Whether they be issues with driver availability, road works or schools being closed. With a bit of background knowledge you can answer specific questions like whether there were significant changes when Transdev lost to Kinetic, roads were closed in a particular area or a bus operator had a COVID issue at their depot. Hence I recommend spending time looking at individual routes to check for patterns. I looked at some bus stats last year in this thread.
Conclusion
It's great that we now have performance stats for all modes. I strongly recommend delving into them. If you find interesting patterns in the data then please share them in the comments below.
No comments:
Post a Comment