Friday, June 18, 2021

Building Melbourne's Useful Network Part 95: Victoria's new bus plan


On Sunday June 13 Transport Minister Ben Carroll MP launched Victoria's Bus Plan (2024 link) - release here. It's the first significant bus plan from the state government since Meeting Our Transport Challenges came out in 2006. MOTC (as it was often abbreviated to) also covered other modes but the biggest impact it had was on buses.  

Here's my review. Either read it here or, if you prefer, jump down the page for a video session and chat. Even if you do watch the video make sure you come back here as there are many things explained not in the video. 

History and background

The MOTC upgrades boosted bus service by 25%, sparking a similar rise in patronage. Key MOTC initiatives were (a) minimum service standards on over 250 Melbourne bus routes (hourly until 9pm, 7 days), (b) new SmartBuses, mostly comprising orbital routes around Melbourne and Doncaster trunk routes, and (c) local area bus reviews. 

The MOTC program was about 60% completed. A substantial number of popular bus routes that should have it remain without 7 day service, not all promised SmartBus orbitals were completed and many bus review recommendations didn't proceed. The goal of synchronising timetables across train, tram and bus by years' end was never plausible and remains unresolved in 2021. Nevertheless MOTC deserves credit since what it achieved for buses far exceeded anything else for decades prior and in many years since. That includes 1988's MetPlan that fell victim to the early '90s recession.   

Bus network reform became cheaper but bolder after Labor lost government in 2010. Point Cook, Brimbank and some areas served by Transdev got radically reformed bus networks. However unless the buses were to feed new stations the funding was limited so these were 'smell of oily rag' upgrades. They lacked the grand sweep of the SmartBus orbitals but were cost-effective patronage successes locally. 

Not long after Labor returned in 2014 the transport minister Jacinta Allan flicked the switch to 'big build' infrastructure. Political interest in service or network reform slumped. The 2018 election saw the public transport portfolio briefly under first-time minister Melissa Horne before being taken up by the current and more senior Ben Carroll. Under his watch previously eschewed terms like 'bus network reform' could be uttered again. As indeed it was in 2021 budget documents.   

The plan

What's in the plan? There are 6 aims, 6 reform objectives and 6 actions. 2021 to 2023 will be mainly preparatory work with the big action happening from 2023 to 2030. The plan doesn't have funded initiatives for these so is dependent on future budgets.  

There's more after 2030. This is less defined but the thrust seems to be to build up buses as legitimate mass transit. The last attempt at this was over 10 years ago when SmartBus and DART routes started.  

These were big steps forward at the time. However with still slow travel times on the orbitals, half-hour waits at some times and, for a while, appalling cleaning and maintenance, SmartBus barely deserved to be regarded as a premium bus service. And within Australia it is inferior to the busway systems in Brisbane and Adelaide and even the frequent on-road 900-series routes in Perth.

Arguably this is less important in Melbourne due to our large train and tram networks. However it does make our fast public transport network notoriously radial. It may be that this inadequacy gave rise to the biggest proposed public transport project of the lot, the Suburban Rail Loop. Still that's just one corridor and fast and frequent buses remain needed to link key suburban hubs to each other, and on corridors like Doncaster, to the CBD. Not to mention the potential for the SRL corridors themselves before rail services start. Hence the plan's interest in reviving the neglected mass transit role for buses. 

Note the timing of the state election (late 2022) in all this. I'd imagine that work would be sufficiently advanced to be able to make some announcements in the campaign leading up to it. Due to the lead time involved between funding and implementation for a new bus route (about 2 years), the 2022 budget should give some clues as to how rapidly the government will move on bus service reform and expansion.  

The plan sets the scene with a 'what we know' section. For example frequency, span and timeliness of service are stated to be the primary drivers of customer satisfaction. These are the basics and it's really good that the plan acknowledges this. The plan even has an 'every 10 minutes' icon to hammer this home. 

The rise of a specialised 'user experience' professional group, split from planners (who should incorporate usability in their normal work) may have contributed to past misguidance where cost-adding gimmicks (eg free wi-fi) were given greater prominence than basics like useful routes and good service. This bias might, at last, be righting itself.  

Another thing that's obvious but always bears repeating (which the plan does) is that most passengers walk to the bus. Which figures as buses are the nearest public transport to two-thirds or more of the metropolitan population. Walking access to stops is key. Progress here requires work from parts of the Department of Transport well outside bus planning such as that responsible for roads. Importantly access needs to be viewed from a directness and catchment coverage lens as well as a safety lens (that if applied on its own can make walking around roads and barriers so indirect and convoluted that people either stay home or drive, thus perversely achieving pedestrian safety objectives).  

Use of information about the service is about evenly split between online and at the stop. We need to do a lot better on the latter, especially at interchange points. This is most effective where you've got a legible network. In the words of the plan we need to 'unscramble complex routes'.  

The plan talks a bit about innovation. It's worth a cautionary note here. Nothwithstanding some job titles in the Department of Transport, it often gives better returns to do something that's proved and successful in 100 places than 10 instead of chasing every last speculative 'innovation' for 'pilot projects'.

Demand responsive / flexible route services may have a place but it's not a very big one if you've got a well developed local and trunk route network. In Rowville they've made what I consider a mistake in starting FlexiRide before revamping the regular network then considering whether flexible routes are still needed at all. Flexible route services are discussed in more detail here

Before you can fix a problem you need to know what it is. The plan diagnoses key issues with bus services well. 

The mismatch between demand and service level was particularly noteworthy as it implies opportunity for cost-effective network reform that is generally beneficial. This should be done sooner rather than later as it needn't wait for large funding. At the same time we need to be mindful of the big picture, which is declining service per capita in the last 8 or so years, and that more bus service kilometres are needed to deliver true network transformation, especially more ten minute corridors.

Praiseworthy is the aim is to integrate bus reform with 'Big Build' infrastructure projects. This is well overdue. Many bus routes stay one side of the railway line in areas like Box Hill, Ringwood and St Albans as long boom gate down times would have reduced reliability. Removing level crossings would lessen that problem but bus routes were largely not rethought to take advantage of this. Hence level crossings remain somewhat of a 'Berlin Wall' for bus passengers still forced to change despite better road access across them. 

Another example is Southland Station which could have spurred on local bus reform, for instance simpler routes and a direct bus along Bay Rd to Sandringham (which could be beneficial when rail lines are closed for future projects). So I hope the plan encourages some catching up on neglected network reform at sites like these. 

Net zero emission buses is another theme. There are currently trials and general consensus we should be moving faster. There was an announcement about a faster transition in the 2021 budget. It's even better if we get people into high occupancy zero emission public transport which is why you also need network reform. 

Planning bus travel is acknowledged as being complicated. Mention is made of the need for real time information and simpler journey planning. It was good though that direct routes were mentioned. This is critical as far more people know their main roads than their bus routes. I'd have liked more mention of the need to simplify timetables and operating patterns. For instance on the long weekend that the plan was launched confusing variations on what bus routes ran on the public holiday Monday made catching buses a gamble

Six reform objectives

These can be summarised as: 

1. Making the network simpler, faster and more reliable

2. A cleaner, faster fleet. This may include smaller and larger buses. With a transition to zero emission. 

3. Better performing buses with priority measures and better interchanges. The rapid running trial on Route 246 where buses maintain a headway rather than a timetable is also mentioned as something that could be done more widely (although there is only one other standard bus route in all of Melbourne with a 10 minute weekday frequency - the 402). Implementation here would requires a different approach to measuring performance, for instance reliable headway maintenance rather than notions of lateness against a timetable. This in turn flows into how operator contracts are written including penalties for under performance. 

4. Better customer experience. Includes factors like accessibility. I'm pleased that network design is included as a factor here. Timetables could have been mentioned more since we have so many routes with restricted operating hours and days. Or non-clockface frequencies (like every 22 minutes) that are hard to remember and don't mesh evenly with trains every 20 minutes.

5. Governance and systems management. This is important as from personal experience information systems are not as stable, reliable and accurate as they should be. Especially during times of disruption. 

6. Better value for money with industry partnerships and presumably revised operator contracts or franchises. I wrote about metropolitan bus franchising here

Service categories (Good in theory but poorly articulated)

A lot of the meat in the plan is listed under the first point that defines a hierarchy of bus routes. It is very good that there is one. Routes are divided into four categories with (mostly) two or three subcategories under each. 

However I though that for it to be a genuinely useful planning aid it could have been less muddled and more specific. Read it below and judge for yourself (Click it for a clearer view).  


Category 1 is your top tier. These comprise Bus Rapid Transit services (eg City - Doncaster) and shuttle routes to major trip generators like universities. The BRT routes would offer frequent all-day service, presumably operating over long hours like the trains they are supposed to replicate. Shuttle routes would serve a more select market. They are not explicitly listed as frequent though they really should be if they are to earn top tier status. 

While we're talking about top tier services, it's worth mentioning that the plan has a picture of a SmartBus. This was the top tier in the 2006 plan and was significantly rolled out in the orbital and Doncaster routes. However its roll-out stopped short of certain ex-Met routes, like the 220, that had SmartBus or better service levels.

The plan also doesn't explain how SmartBus fits into its service categories and subcategories. If you were to reappraise SmartBus today most route sections would be in the top two categories. However quieter parts may only justify a local route service level. Any good bus plan will need to tackle the future of the SmartBus orbitals including whether they should be split to better match service provision to usage and harmonise with trains. Area and network rather than purely operator based thinking will be required to prevent a repeat of problems in 2015 when splitting was last attempted.  

Also relevant is the Principal Public Transport Network (PPTN) which is your top tier of the network across all modes (including buses). It's supposed to reflect and guide planning, zoning and personal location decisions. The Bus Plan's category hierarchy does not mention or integrate with the PPTN, indicating a disconnect between land use and service planning within the Victorian government.   

Category 2 is your more important suburban routes that may operate in mixed traffic. The most direct are 'trunk routes' that may have bus lanes. A step down are fairly direct connector routes. Their frequency and operating hours are not specified but it is mentioned that travel time should be good enough for car drivers to consider their use. Finally in Category 2 are Neighbourhood routes. These have a shorter span of hours but are strongly patronised. The two don't necessarily go together so I'm assuming that these are well used routes in densely populated areas or with favourable demographic characteristics. 

Category 3 is Local routes. They provide a minimum level of service (presumably every 60 minutes, as per the MOTC standard). However in their description it is hard to understand how they differ from the 'Neighbourhood routes' in Category 2. Maybe their population catchment is sparser? The bottom tier of this is demand responsive which in all versions tried here has limited operating hours and days. 

Category 4 is school routes, presumably operating one trip each way on school days only. They would run where a trip not provided for by a regular route is required. 

If you were going to create a bus network service hierarchy there are several characteristics you could use to define the groups. For example operating hours, frequency and speed (including whether the bus has its own right of way). 

By poorly defining operating hours or frequency standards the table above does not provide a sound means of classifying service. This is important because without it you don't have service standards and thus can't properly communicate what passengers can expect from buses. That flows back to issues of complexity that the plan correctly said was wrong with existing bus services.

The annotated table below is my attempt at 'reverse engineering' if you were to map service levels to their categories. I've included some example bus routes. But there are still some gaps and the top category frequencies I've guessed could be described as 'aspirational'.  


Even after that I didn't particularly like the classifications. It also leaves some service types out, for example peak only routes or off-peak shopper routes. These are very much minor supplements rather than mainstream in a developed bus network but should still have some place in the classification. And, as mentioned before they don't map very well to either SmartBus or the PPTN. 

An alternative bus service hierarchy that matches trains

If I was to design a service hierarchy I'd explicitly state operating hours and frequency with a minimum standard in each category. I'd have three main categories for (mostly) seven day routes with a fourth category for special purpose routes. 

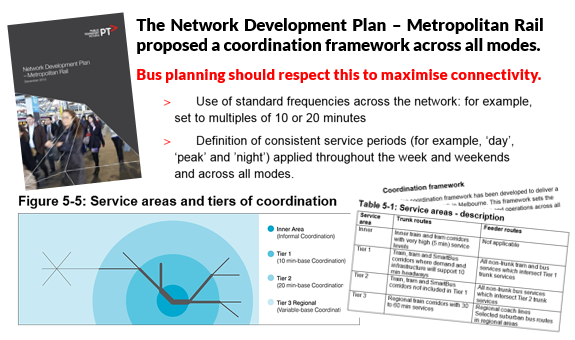
To match recent Metro rail planning and practice (which call for a 10 minute main line daytime frequency and a 20 minute evening or branch line frequency), I'd do the same for buses with off-peak frequency being the main determinant of categories. 

It's not just me saying this; so was PTV (the DoT's predecessor in transport planning) who said it in their multimodal 'coordination framework' in their Network Development Plan - Metropolitan Rail from 2012. Any excuse in 2021 that better defining these should wait for a later document doesn't hold water since the Department merely needs to use work already done. 


A tidier set of service categories (which is critical to budgeting, work planning and priority setting - ie the whole success of the plan) could look something like this: 

Tier 1 would generally be every 10 minutes or better with long operating hours. This would match the Principal Public Transport Network and the portions of the SmartBus network that you would keep (I've advocated splitting SmartBus orbitals and reducing service on low density poorly used portions). Subcategories would cover BRT services, busy road services and frequent shuttles (that might have shorter hours). Only a few routes are currently in this category though the number increases if you count co-scheduled multi-route corridors (eg 200/207, 250/251, 905/906/907 etc). 

Tier 2 would generally be every 20 minutes or better with medium to long operating hours. This would be the Useful Network as often discussed here as the minimum service on all main roads and between substantial trip generators. Routes such as the 170 and 180 between Tarneit and Werribee already operate at close to the service levels defined here.  Also in this tier are what I've called 'Dense Local'. This is a category of routes in areas that have density or demographics particularly favourable for buses. Existing routes that run through them have above average patronage and deserve an upgrade. Example areas might include Craigieburn, Tarneit, Sunshine, St Albans, Glen Waverley, Springvale, Noble Park and Dandenong. Tier 2 routes might also be created by simplifying straightening or amalgamating lower frequency Tier 3 services as would be the 'bread and butter' of many local area network reforms. 

Ideally most people will be within 10 minutes walk of a Tier 1 or Tier 2 route. Improved passenger information at stations and interchanges would stress routes in this hierarchy (eg thicker lines on maps, more multimodal information, etc). 

Tier 3 is your neighbourhood suburban coverage routes every 30 to 60 minutes. They would meet minimum standards (ie at least hourly until 9pm) though there would be significant flexibility where needed. For example peak service could be higher in areas with a lot of school children and peak commuters. Many routes still fall below this tier because they don't run 7 days or are short hours only. Adding service hours to bring the busier of these (eg 536) up to the minimum standard would be the other high priority. 

Tier 4 are special purpose routes. For example they might be for school, commuter peak only, shopper or exurban routes where minimum services are not justified. Any demand responsive services (which would be a last resort for special needs not covered by Tier 1-3 routes) would be Tier 4. 

The table below shows these tiers. Advantages include better clarity than the table shown in the plan, better integration with trains and better compatibility with the PPTN and a reformed SmartBus. 


Key to hours: Long = 5am - midnight, Medium = 6am - 9pm, Short = 7am - 7pm.  

Service hierarchy as a tool for reform

How might one use a service hierarchy to weigh up priorities, inform budget submissions and plan bus reform work sequences?  

As a 'first cut', routes could be assigned a category that reflects their current service level. 

Then thought should be given to the category they should have. 

Deservingness could be determined with data like growth prospects, boardings per service kilometre and maps showing social disadvantage or car ownership along a route's catchment. 

Routes that score highly would get a promoted classification and a positive outlook for service. More frequent but quiet routes serving low social needs catchments in low growth areas could get a negative outlook. 

Notes (with symbols like crosses and question marks) could advise where a route is so useless or confusing that it should be deleted or reformed. This does not substitute for a full network review but is still worth doing for all metropolitan routes. The table below shows the concept for a few routes.  


This 'first cut' analysis could provide 'existing conditions' background information for detailed implementation plans and area reviews. These will capture instances where you'd only upgrade or demote routes if associated with reforms to other nearby services. This approach makes it easier to win public acceptance of new networks based on 'swings and roundabouts' reforms than instances where it is all cuts. This is too detailed to be in a plan like that released on Sunday but would instead form the substance of the Bus Reform Implementation Plan and/or area reviews. 

Detailed plans are essential. However they should not be used as a reason for deferring useful and beneficial upgrades. Especially where early implementation would not prejudice future likely network reform and where improvements jump out for action now.  

High priority examples include: 

* Popular routes where there are conspicuous service shortfalls. For instance three or four times as many trips on weekdays than Sundays despite high weekend usage. In other cases just a few extra trips can bring its frequency or hours up to the next tier (or even just the hourly to 9pm minimum standard). Examples include routes where service collapses on weekends to major shopping centres (eg 279, 406, 408, 703 and 800) or popular peri-urban destinations (like 685 and 788 - both included in recent budgets). 

* Crowded routes whose low to medium frequency but favourable catchments mean they are too productive for their own good with a mismatch between usage and service. The plan identifies this as a real issue that is holding back the usefulness of buses. Examples include routes like 150, 160, 495, 529, 533 and others listed before on some days of the week. Boosting these types of services is key to making buses useful in areas where people will appreciate and use them.  

* Well used but underserviced local routes in areas with high social needs. The case for upgrade may be strong where services don't meet minimum standards, eg short operating hours or no Sunday service. Examples might include 404, 414, 506, 536, 804, 814 and 844.

Implementation sequence

The above are three cases where you might improve service as soon as you can. Where the case is compelling the decision to proceed on selected routes might be made even if the implementation plan wasn't finished or there was no intention to review other routes in the area for a while. 

There was a hint of such early work in the minister's release which mentioned adjustments to the timetables for 19 routes from September 2021.  Changes like these might be the low-cost 'low hanging fruit' that could be cheaply done by reallocating service resources within a route or bus operator. 

Later the reviews could start by seeking opportunities to simplify Tier 3 routes to get their services to a Tier 2 level for relatively low additional cost. This is more complex where it involves route reform and potentially several different operators in an area. But in some cases reform may still be relatively economical, with a lot achieved from funding more driver hours rather than large-scale new bus purchases. 

While these were being implemented bus infrastructure could then be planned. These could support bus priority measures and busways including bus wormholes through slow spots with many buses serving major destinations. When these come on stream more Tier 1 services, typically every 10 minutes or better and likely requiring large scale (zero-emission) bus purchases, could be added.  

Six actions

Getting back to the plan, its six actions are as follows: 

1. Develop the Bus Reform Implementation Plan

2. Work with industry towards a zero emission fleet. 

3. Transform the bus network to better meet user needs. 

4. Systems and technology for better data and passenger information. 

5. Measures to improve customer experience.

6. Enhance on-road priority for buses.  

Of these the most detail appears to be in the Bus Reform Implementation Plan. This will be developed with input from industry and other stakeholder. It's not know exactly what form this plan will take, eg whether it will be a single document or several, possibly arranged by topic or area. 

Early initiatives announced on Sunday are as follows:


We don't know much about the 19 routes that are involved in the timetable changes. However we know that 223 and 293 (both run by Transdev) were mentioned in a Herald Sun report. Network reforms will be on the Mornington Peninsula, Yarra Valley and Fishermans Bend. The proposal for a shuttle between Melbourne University and Victoria Park Station is still alive. The local network in Doncaster will have some big changes once the proposed busway comes in to operation. More on these changes here as timetables come to hand. 

Numbers, measures and funding

Where could the plan have been stronger? Compared to Meeting our Transport Challenges, this plan is quite short on numbers. There are no broad goals, such as the number of people and jobs that would be better connected. Maps are absent. Even the 19 routes getting new timetables in September 2021 did not get listed in the media release or supporting information.     

The plan diagnoses the problems well but there's no targets for network operating hours or frequency even at a 'minimum standards' level such as contained in MOTC. Even if specific routes were not listed  against them, having a clear service hierarchy with specific operating hours and frequencies would have added substance to the plan. After all, as the plan acknowledges, these are key drivers of satisfaction.

Good plans are measurable. High level measures that might have been useful here include those related to coverage and service level. For example the proportion of people within 400 metres of a bus operating every hour for basic coverage. Or, for more widely useful services, the proportion of people and jobs within 800 metres of transport every 20 minutes or better. The roll-out of buses in growth areas could improve scoring on the first while the extent and quality of bus network simplification and reform could improve the latter measure. As could land use if denser housing and jobs are clustered along main routes. This could happen if the PPTN had a higher profile in planning and funded bus plans respected it.   

Also notable was the absence of a mode share or patronage target. That doesn't mean there was never one; at one point the Department hoped for 200 million annual bus passengers by 2030 but wiped the goal off its website and left it out of the plan. Possibly this was due to uncertainty over COVID which has hit patronage. But to put this target in context, 200 million trips is less than that which (until recently) was carried by our trams with a much smaller network coverage. 

It looks like we'll need to wait for the Bus Reform Implementation Plan for details that some would have liked to have been presented earlier. This makes this document more a 'plan for a plan' strategy than something with targets, dollars, time-lines and well developed network concepts like MOTC had for SmartBus and minimum service standards. Also critical are state budgets for the next seven or eight years. The allocations these make for buses will determine to a large extent the plan's success or otherwise. 

Conclusion

Victoria's Bus Plan is the most important bus policy from the state government in fifteen years. Its writers deserve credit for accurately diagnosing the problems with buses and their proposed way forward that, if funded, should result in significant improvements. 

It also signals renewed political and administrative interest in bus service reform after a long period where transport infrastructure projects took precedence. This is also welcome. 

It is however a high level plan. There are few measurable targets and only a vague service hierarchy that does not take advantage of work already done around intermodal integration. Its success will thus depend on the availability of funding and the rigour of the Bus Reform Implementation Plan process that will need to contain detail not in the high level plan. 

If you prefer listening to reading this video is my take on the plan. And there's responses to questions and comments from viewers. And don't forget to subscribe to MelbourneOnTransit on YouTube!


What do you think about the plan? Was more detail needed or does it represent a good start? Your comments are invited and can be left below. 

See other Building Melbourne's Useful Network items here

PS: For a multimode plan that never was, see this Daniel Bowen blog post. It was developed as part of modelling for the East-West Link. Page 18 contains ambitious SmartBus networks much bigger than now. Download it from here


Tuesday, June 15, 2021

Timetable Tuesday #122: Doncaster's very quiet 295

The City of Manningham has what you could call a three category bus network. There's the four DART  SmartBus routes (905, 906, 907, 908) plus the 305 that operate west towards the CBD mainly for commuters, the three orbital SmartBuses that run roughly north-south (901, 902 and 903) and a collection of limited hours local routes (mostly 200-series numbers) that connect to shopping and transport hubs in the area or just outside. As proof that things are never very tidy in bus land, there is the long-hours almost SmartBus 279 and a handful of 300-numbered peak express city routes defy categorisation.  

The 295 is one of the area's local routes. It runs roughly south-west to north-east from Doncaster Shoppingtown to The Pines. The individual route map is below. 


The PTV area map shows the 295 with other routes. It has very little unique coverage. What there is is north of King St. It parallels the 279 along Victoria St. Three in every four weekday Route 279 trips operate to Shoppingtown. But the confusing thing is that if you catch the 279 to Shoppingtown you must wait at a northbound stop whereas if you want to get the 295 to Shoppingtown you must board at a southbound stop. 


Timetable

Currently run by Transdev, it was formerly National Bus and before that Met Bus (who inherited routes from the Tramways Board). Its timetable remains many of these traits. For example ex-Met bus routes rarely got upgraded to the 9pm finish that many other routes gained in the 2006 - 2010 period. Hence you will still find that they are either long hours (more like trams) or very short hours, often daytime service only. 

Weekday service is roughly from 7am to 6pm with a flat 30 minute frequency applying. This makes it basically a shopper service. It may have some use for those changing to a CBD SmartBus in the morning but the early finish, with service stopping partway through the evening peak, would be a limiting factor in the homeward direction. 

Saturday and Sunday (unusually) have identical timetables with an hourly service between 8 am and 6pm. The 60 minute Sunday service is better than what ran prior to the 2014 Transdev network restructure, where it was 120 minutes between buses.  

History 

The 295 used to be longer. Before the 2014 network reforms it ran from Shoppingtown to Box Hill. It paralleled several other routes but provided a one-seat ride from eastern Doncaster to Box Hill. More on those changes at BCSV here

Unlike most other parts of Melbourne the Manningham area has had several new bus networks and renumberings. The 295 route number has been in use on this (or a similar) route since at least the mid 1990s. 

Usage

Route 295 is poorly used on all seven days it runs. In late 2018 it attracted 11 boardings per service hour on weekdays and 9 boardings per service hour on weekends. This is about 50% that of the average for buses in Melbourne. It can't all be attributed to poor catchment demographics; parts of it overlap  the 279 which is an exceptionally strong patronage performer. Removing the Box Hill portion might also have not helped its numbers. 

Conclusion

The 295 bus is a neighbourhood bus route uniquely serving quite a small area in a generally high income district with more frequent service provided by other nearby routes. What should its future be?

You might be able to make a case for 295 to be (a) removed in favour of boosts to more productive routes in the area, (b) reduced in service given its little unique coverage or (c) included in bus network reform such as operating to Templestowe Village (instead of The Pines) in conjunction with a simplification of Route 279 so that all its trips run to Doncaster Shoppingtown.

Comments are invited and can be left below.  

Index to Timetable Tuesday items


Friday, June 11, 2021

Building Melbourne's Useful Network Part 94: Where Melbourne's road grid is broken & why it matters

If you want a sensible transit network you need a sensible street network. Buses can only go where the roads are. If they are too narrow buses can't run down them. Windy streets make for slow and confusing transit routes that are expensive to run per passenger carried. And their poor permeability can make walks to stops longer than they should be.  

How road design cuts permeability for walking and buses

No person has harmed the ability to design and run good bus public transport more than the 1960s/70s road traffic engineer and their modelling and planning doctrines that remain too influential to this day.  

Such designers, smitten by the clean lines and smoothly flowing illusion of Le Corbusier modernism, did not like the mixed land uses of towns and suburbs that grew organically. And it's true that some were quite noxious in a more agrarian and industrial age. 

Neither did they like streets having multiple purposes, for instance as a thoroughfare, shopping strip, tramway, place to park, local access and frontage to many properties. That required numerous day to day interactions and was seen as fussy for a streamlined age (in the same way that ornate Victorian architecture fell out of fashion and was bowled over by the wrecking ball).  

To manage the growing number of cars planners sought to separate out various land and road uses. Expensive schemes based on keeping the roads at level but elevating walkways and sinking trams (mostly) didn't happen here. But busier roads were widened (with property resumed) and/or (outside Melbourne) had trams removed to maximise car traffic throughput. Newer roads got made as controlled access highways with no property frontages or permeability for those crossing. 

We were told these were safer per kilometre travelled (which wider roads induced more of). The biggest of these were freeways that punctured an existing finer grained road grid, making some short local trips inconvenient. Walking, if provided for at all, was made particularly hostile, with no passive surveillance and significant backtracking.    

As sort of a trade-off for being ringed by busy roads the internals of planned neighbourhoods in cities such as Canberra were planned around a primary school and small group of shops. This was because at the time a lot of this planning was done most children still walked to school and car ownership amongst housewives and older people (in particular) was not universal. Footbridges over main roads were sometimes erected but their cost limited their number to a few sites mostly near schools. Also they were inferior to level access due to the extra ramp or stair climbing and lack of shelter they subjected users to.  


The road hierarchy was based on cars coming off main roads (often at roundabouts) onto somewhat bent distributor streets and then very winding local streets intended to tame and slow cars.  Culs-de-sac were sold as providing freedom from through traffic in family neighbourhoods but reduced permeability for walkers. 1970s era Radburn designs also featured internal paths to separate people from traffic. However this came at the cost of inferior passive surveillance that gave rise to fears of crime, especially in areas that were (or became) disadvantaged.  

Unemployment (which ratcheted up in the mid 1970s and again in the early 1980s and early 1990s), falling family sizes, school sell-offs, the growth of the dual income family, higher car ownership, extended supermarket trading hours and larger drive-in shopping centres caused the closure or deterioration of local facilities. So although suburbs might have been internally walkable, there was less you could walk to within them. 

While services in the next suburb may be walkable (as the crow flies), roads and roundabouts built purely for car throughput lessened directness and permeability. In theory longer but still local trips could be done by bus. However local street layouts (favouring T-intersections over cross roads that were considered less safe) hindered simple, direct and frequent bus routes. And typical 30 to 60 minute  suburban frequencies made the buses we ran unattractive, especially if a connection was required. 


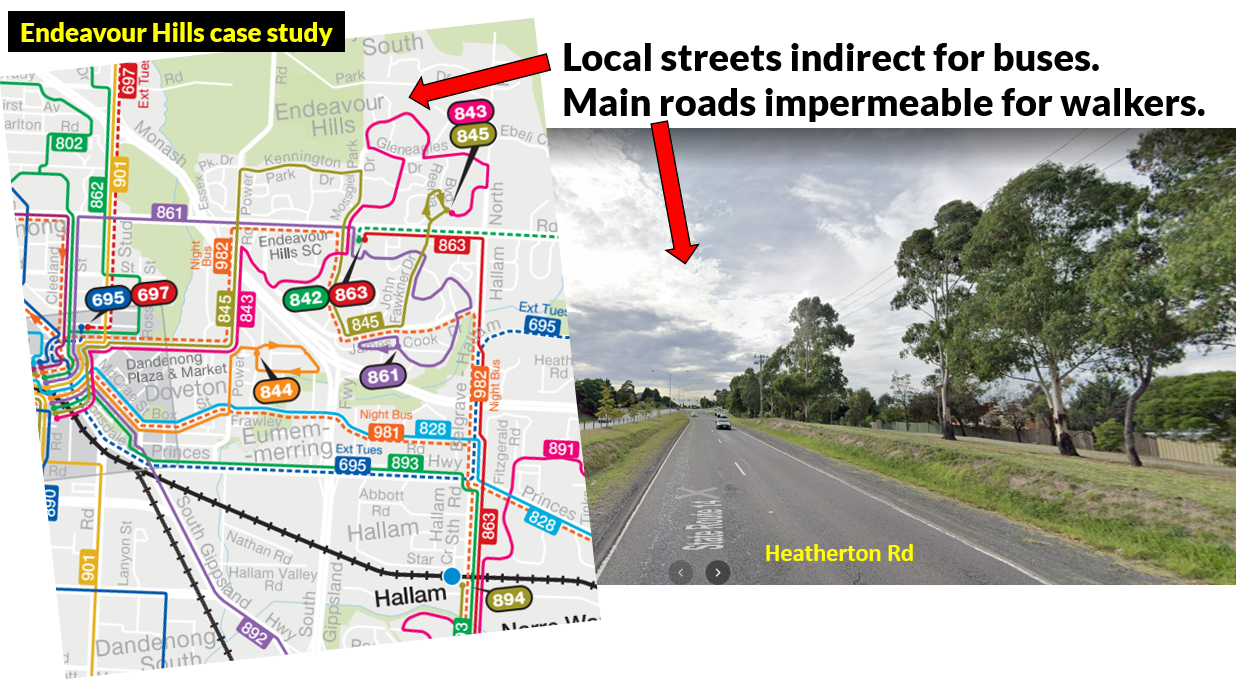
A similar example to Canberra suburbs like Weston Creek is Endeavour Hills in Melbourne's outer south-east. It got a revised local bus network last year but the street layout constrained what could be done. Heatherton Rd is a potential corridor for a frequent bus between Dandenong and Fountain Gate that could serve a large catchment. However much of it is pedestrian hostile with poor accessibility and passive surveillance. The alternative, of having buses on local streets, is slow due to their indirectness.  


Highways and (especially) freeways can not only sever where people can walk but also other roads that previously formed a finer grained network. That can reduce connectivity for short driving and cycling trips. In other cases the (dearer) freeway may be built but a more modest two to four lane road (that would complete a grid) might remain unbuilt. This can lessen the ability to plan efficient bus routes.  

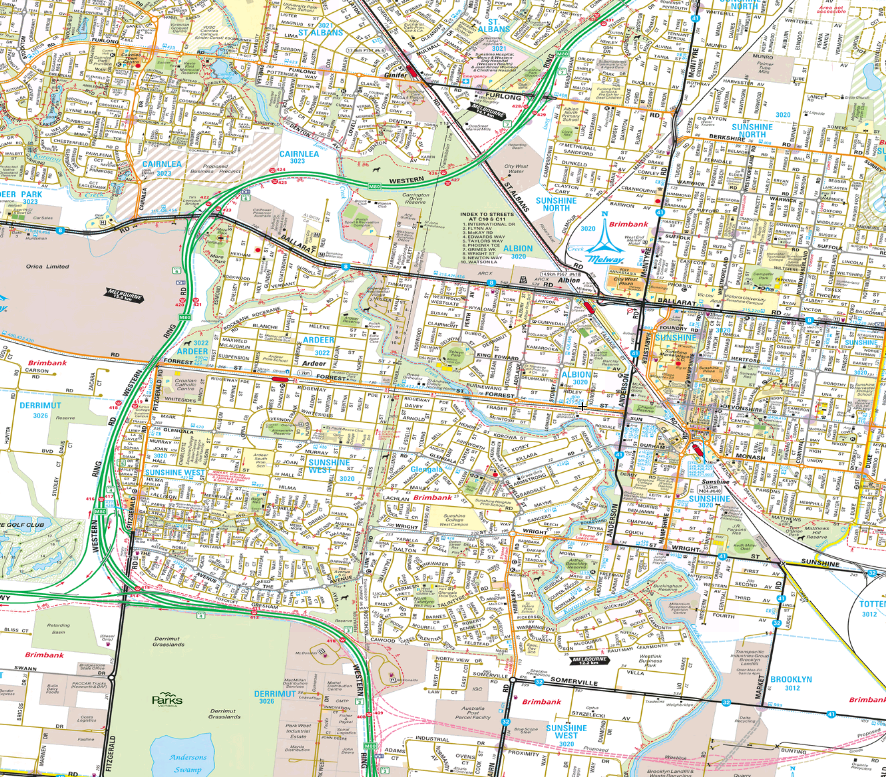
You can see the difference in the maps below comparing the Mt Waverley and Sunshine West areas. Mt Waverley has a complete road grid (with fair permeability, deteriorating at finer levels) and a freeway. Sunshine West has a freeway and an incomplete road grid that results in poor local permeability. Click on maps for more detail. 


A larger view of the Mt Waverley area (but slightly north and east) is here. This gives a better idea of the usefulness of grid streets for grid transport services. Here north-south buses feed east-west trains and trams running towards the CBD. This is good geometry both for bus feeder / CBD train trips and also local travel where access is possible almost anywhere on the grid with one change. It is possibly no accident that the bus routes in the area are amongst the most productive in Melbourne on a passenger boardings per hour basis. Also as relatively few bus routes are needed to provide total coverage (provided streets are optimally spaced) then quite high frequency can be run on each one, further improving the ability to interchange between them. That's how it's meant to work; in practice Melbourne is weak at matching service level to usage with key routes like the 733, 737 and 767 still operating only every half hour at most times - similar to quiet semi-rural routes eg the 695


How fine should transport grids be?

Having established that grids are good for transport access and interchange, how coarse or fine should they be? 

It depends on travel speed. Walking grids should be finer than cycling grids which should be finer than public transport grids. Although if density and trip generation activity is high then you might have very fine grids for public transport, such as for trams in Melbourne CBD. Such grids of straight-running through routes is also more efficient than having everything terminate at a central interchange (which is more common for buses in smaller cities). Rail (especially if underground) is more expensive to build so would typically have wider spacings between lines, with reliance on feeder services to increase its catchment. 

In the suburbs you want to provide good coverage and efficient routes. 400 metres is widely accepted as a reasonable walking distance to a bus stop. In practice people walk further (say 800m) especially to a faster or more frequent service (which in Melbourne is typically a train, tram or one of the relatively small number of frequent bus routes). 

An 800 metre (ie half-mile) road grid would put everyone within 400 metres of a bus stop on one north-south and one east-west route of a hypothetical network. That assumes there is good pedestrian permeability mid-grid including the ability to cross main roads. 

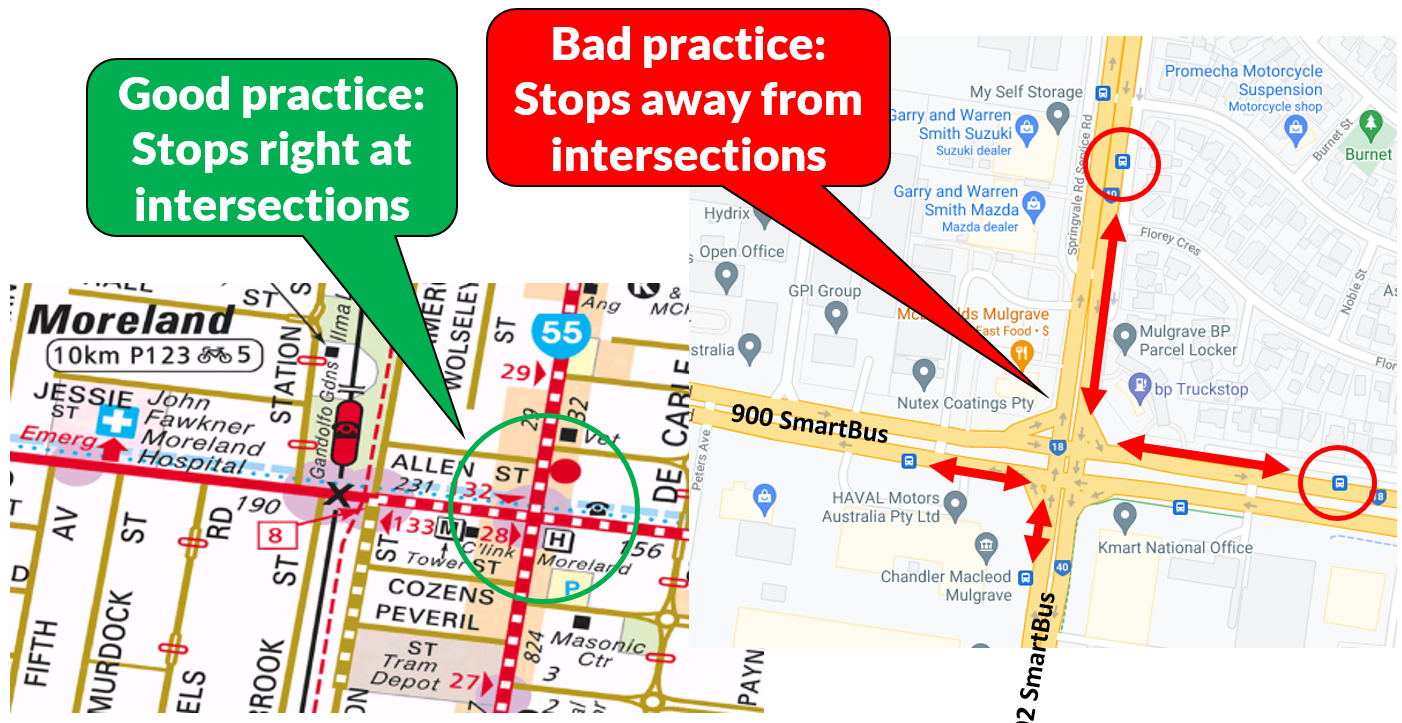
A 1600 metre (ie mile) road grid would do the same but require an 800 metre walk. Assuming the same number of bus resources as where the grid was 800 metres you could run each service twice as frequently and produce a better 'network effect' as waits are less for passengers changing between services. Apart from high frequency the latter requires stops right at intersections, something that Melbourne does increasingly poorly when you get beyond tram territory. Also it is even more important that there be good permeability within grids due to the longer walking distances. 


The 1600 metre option risks leaving the less mobile that can't walk a half mile without service. A variant of this could be to add routes that operate mid-block to provide fill in coverage. In some places this is done. In others it isn't. Again poor within-block permeability can be a reason why it is not done in some areas - you simply can't get a bus through via any logical route. Generally speaking Melbourne's road grid gets coarser with distance from the CBD, with spacing approximately tripling from Elsternwick across to Knox. As the grid gets coarser the roads get wider (on average) with wider turning radii at intersections (bad for locating stops at intersections) and inferior mid-block crossing connections. Much of this is a result of conscious traffic engineering design decisions to maximise car traffic throughput for long distance travel above all else, including local accessibility via all other modes. 

The maps below compare Mt Waverley (which has almost no mid-block buses) and Werribee / Hoppers Crossing (which does). Mt Waverley has not had a recent bus network review but it is unlikely that such a review would greatly change most routes as they are already direct. Werribee / Hoppers Crossing got its new network in 2015 with the main road grid getting direct routes for the first time. Its new network is basically two tier, with the main roads having more frequent service (typically about every 20 minutes) especially in peak periods. The in-between 'coverage' routes (Eg 161 - click to view map better) are typically every 40 minutes. The bus networks in both areas attract above average patronage per bus operating hour volumes. 


To summarise, the optimum grid for buses in suburban areas is probably between 800 and 1600 metres. But if you were going to do the latter then some coverage routes would be desirable. That requires good midblock permeability (ie grids within grids) and (importantly) good connectivity between midblock grids to lessen the number of turns. Some newer areas have done this quite well, for instance the midblock route 151 in Truganina provides good coverage and delivers excellent patronage performance. I stress again that this would not have been possible if the roads weren't designed right.  


Ideally every route would be frequent and you'd have an efficient network that provides good coverage from the main routes without need for low frequency 'in between' routes. You might be able to get away with a grid spacing of 1000 to 1200 metres, ie a maximum of 500 - 600 metres walk. The very furthest midblock areas could be open space (eg parks and ovals) in a square surrounded by family homes. Somewhat higher densities and mixed use retail would be near the main bus-served grid roads. This arrangement should ensure that the vast majority of residents would still be within 400 metres of frequent service in four directions despite the wider grid pitch. 

The above would hold for new areas. In established areas near or between stations, the over-riding consideration is to have a grid that provides for direct roads running directly to stations to allow efficient deviation-free feeder services that can through-route if necessary. This was mostly but not always done in the past. Exceptions I can think of are Toorak and Malvern stations which have poor connectivity with trams (possibly as they were then considered rivals). But today it's important that new stations have locations and designs that facilitate efficient feeder service, especially given their longer distances apart. 

8 gaps in the grid

The following describe some gaps in suburban road grids. These may impede the ability to operate direct bus routes to efficiently serve an area or provide linkages. The gaps may be due to a freeway, railway, private land or watercourse blocking what might be a potentially useful connection. While I will point out these gaps in the grid, I will not comment on the feasability of bridging them; for some the "horse may have bolted". 

Possibly due its more fragmented development, there seem to be more gaps in the west and north than in the more continuously gridded east. Hence all seven are in these areas.  

1. Hoppers Crossing/Point Cook 

Parts are just a stone's throw from Hoppers Crossing Station and even closer to the Federation Trail. But it doesn't look walkable or directly driveable due to the freeway being in the way. Imagine how much better access would have been if Dunnings Rd had extended west to Hoppers Crossing Station. 


2. Laverton 

Freeway users can cross the railway via a road bridge but locals travelling cannot unless they divert via the (newly grade separated bridge) near Aircraft Station. The effect of this is that access from the low income and poorly served residential area north of Laverton Station to its nearest significant shopping centre at Altona Meadows is impeded. Bus passengers need to alight near the Laverton shops, go up and down the rail bridge then walk a significant distance to the inconveniently located south side bus interchange to get a bus to Altona Meadows. Or the more active might climb the Fitzroy St bridge over the freeway and walk to the centre from there.  


3. Sunshine West 

A middle-distance eastern suburb would  have north-south roads every 1 to 1.5 km to form a grid. Not so in Sunshine West where such a road would provide a handy connection to the  growing Sunshine Hospital precinct. It could make a bus route too, providing faster connections to jobs without having to go through Sunshine to change.  

There's a lot of history here, including the alignment of the M80 Western Ring Road and the fragmented piecemeal development of housing (a little bit about every decade) in the Sunshine West and later Derrimut areas. The result is a very disjointed local road network with either missing gaps or sections where the limited access Western Fwy runs instead of a more permeable arterial roads. This limits where buses run so that residential areas have inferior connections to nearby employment areas in Derrimut and Laverton North.  


4. Albanvale - Burnside 

One of the big divides in Melbourne's west is between the City of Melton (including Burnside and Caroline Springs) and Brimbank (including Albanvale and Kings Park). The area is now almost entirely built out. But there's no east-west road connection in the three kilometres between busy Taylors Rd and Ballarat Rd. This means that even for local school and hospital trips people need to take these main roads. From the east Main Rd West (which lines up with St Albans Station) and Neale Rd (which goes to Brimbank Shopping Centre and towards Ginifer Station and Sunshine Hospital) terminate at Kororoit Creek. Rockbank Middle Rd continues east to the creek then still stops. Interestingly Rockbank Middle Rd become a different Neale Rd to the west, indicating a possible long term intention for there to be a through connection. 

This discontinuity also stunts the bus network. Instead of routes that continue, linking destinations such as Caroline Springs to St Albans, they are forced to fold back on themselves. Trips that should be easy are not, requiring a lot of backtracking, waiting and changing. 

Poor local transport access can create issues for schools with very different enrolment statistics for those in newer areas (eg Caroline Springs) versus established areas (eg Deer Park North). That can create cases where some schools are bursting while others have spare rooms (although it's not all about transport - there are also socio-economic, leadership, prestige and reputational issues at play that affects the relative fortunes of schools).    


Burnside has been Caroline Spring's older but less known sibling with its average incomes being lower than newer areas. Parts were built before Caroline Springs got established. Met buses used to terminate there (eg the old 216 bus) even well after the Caroline Springs Town Centre got built a short distance away. Burnside suffered from poor connectivity in all directions except for Ballarat Rd to the south. It was only a few years ago that the Westwood Dr bridge was built to connect it to Caroline Springs town centre. When this was done the 426 bus (which replaced the 216) could be routed via the bridge to improve local connectivity. However as noted before Burnside and especially the newer Burnside Heights still lacks connectivity to the east. 

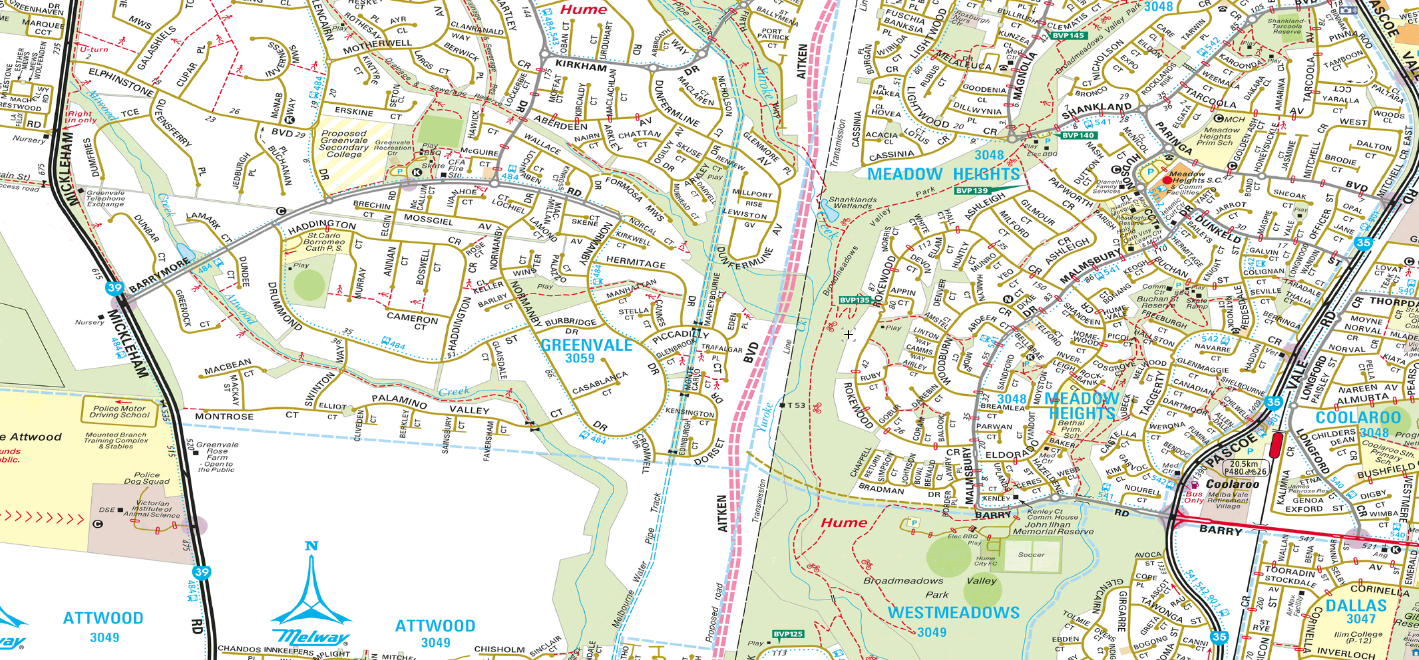
5. Greenvale - Meadow Heights/Coolaroo

Just above I mentioned the two Neale Rds that did not connect. A similar trick happens just on the other side of the airport. Greenvale has a Barrymore Rd that extends east from Mickleham Rd. Then shown in dotted lines on the other side of Aitken Bvd is Barry Rd. That runs quite near Coolaroo Station and then on past Upfield Station through populated suburbia. Barry Rd crosses Sydney Rd, narrows to become an industrial area road then stops at Merri Creek. 

But on that same alignment another Barry Rd starts east of the Hume Freeway and runs a short distance to Edgars Rd, Thomastown where it finishes. This end is about 1km short of the main shops at Lalor and about a further 1km short of McKimmies Rd which runs directly to Bundoora RMIT. 

The absence of a continuous road between Somerton and Broadmeadows Rd mean there's quite a few kilometres where there's no east-west connection. Greenvale is quite low density but faster growing areas west of Mickleham Rd are not. For buses it means that Greenvale routes cannot feed trains at the nearest station of Coolaroo. Instead they must go south and then east along indirect local streets. Or people backtrack to Roxburgh Park Station. 


With wetlands, grasslands, a freeway, two creeks and significant private property, I can't see Barry and Barry joined at the Thomastown end any time soon if at all. But one should be aware of how the lack of connectivity has shaped the bus network. Again it has caused local bus routes to fold in on themselves, lessening access to areas just to the outside.  

6. Airport West - Glenroy

For years it never had transport. Then Gowanbrae people complained. It then got a flexible route bus to the Airport West shops and tram terminus though usage isn't high. This is a prime case of a hemmed in suburb  that shouldn't have been built being developed. It has man-made and natural boundaries on all sides and just one road in and out. 

Crow-flies though Gowanbrae is only a short distance from Glenroy Station. If there was a way of getting a bus from there to Airport West with better road permeability then Gowanbrae would be connected into the network. Such a route would likely prove successful as it would attract some through passengers from both directions given how much time it could save compared to the existing indirect train + bus trip via Broadmeadows.   


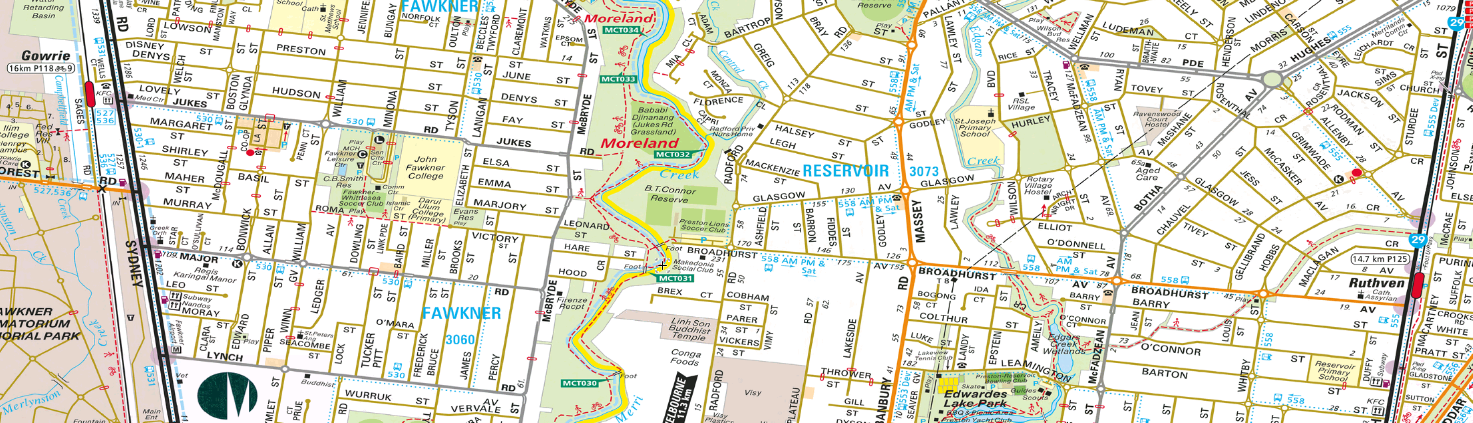
7. Fawkner - Reservoir

Here's another east-west gap in Melbourne's north. Its presence makes Fawkner inaccessible from the east and Reservoir inaccessible from the west. If there was a road through (even if single lane/bus only) an extended bus route 536 (currently Glenroy - Gowrie) could provide a potentially useful link across the north. Also it would allow a tidying up of the very complex routes 553 and 558 in the area (although there are other ways to simplify these without involving the 536). 


8. Watsonia North

Except (possibly) as a faster route for dead-running Dysons buses to return to their depot, the Metropolitan Ring Road does nothing good for public transport access. In fact it could be the reverse. Had its alignment been instead used for a non-freeway road with more access points it would provide a means for public transport to serve currently unserved Watsonia North and parts of Bundoora with a direct RMIT - Greensborough route. But this is not to be. The area either has no walkable public transport or partial coverage from the confusing and duplicative route 566


Conclusion

I'm not going to claim that all these road gaps could be economically bridged now. However transit access in these areas suffer because of them. Their existence highlights how important a continuous yet permeable grid is in providing a useful on-road public transport network. Or even any sort of service at all. 

Bad geometry, including the non-availability of a road grid for transport access, should be grounds for refusing development permission for new suburbs or density increases in established but inaccessible locations. Also road infrastructure investment should be channelled to completing grids in areas that currently lack them especially where this enables improved walking, cycling and bus access. The example from Perth below shows how simple and cheap grid completion can be where in favourable circumstances. 


For now though it's over to you. Where else in Melbourne is our road grid broken? Where would completion of it allow better transit access? And are there places where cheap remedies are possible like in the Adie Court example. Comments can be left below.