Friday, April 08, 2022

Worth taking seriously: DoT's Movement and Place in Victoria

As I noted here, one of the good things about the currently happening Suburban Rail Loop Inquiry and Public Hearing process is the analysis and documents it brings into the public domain. This includes a lot of internally prepared material that outsiders wouldn't know about or even have access to.  

See this big long Twitter thread for summaries of examples. 

Two tabled documents that caught my eye due to their applicability across all of transport (not just the SRL) is the Victorian Department of Transport's Movement and Place Framework. 

Tabled document number 379 is the Framework while 380 is the technical appendix. Today I'll run through them both and explain why they are important for people involved in transport planning and advocacy. 


Movement and Place Framework

On its website the Department of Transport describes Movement & Place as a way of thinking about the roles and challenges for our transport system now and into the future. It is a decision-making framework that outlines competing interests and reports performance in terms of movement, place, environment and safety outcomes.

It encourages a view that roads and streets are not always just a way to get from A to B. Instead many have other roles including being parts of great places and precincts. This thinking involves weighing up the relative scale and importance of these activities and using this knowledge to drive planning priorities. 

The DoT and Vicroads have organised Movement and Place training courses for transport professionals. DoT also publish the 40 page Movement and Place in Victoria introduction here. This is Document 379 as tabled at the SRL hearing. It introduces the reader to the four modules of the Movement and Place framework (network classification, network performance, options development, options assessment). 

It evolved out of old hierarchical road classification models based on traffic handling capacity. This progressed to SmartRoads (including different transport modes) and then to Movement and Place (which, as the name suggests, adds place to form a two dimensional classification system. Similar concepts used overseas include 'Link and Place' in the UK and 'Complete Streets' in North America.

Use of Movement and Place is intended to be within the context of broader principles, as set out below. 


Module 1 is about classification. This is on a scale of significance, from local to state significant. Assessment is based on both movement and place scales with a grid style matrix to compare sites, something like below. (click for a better view)


Module 2 looks at performance. Four criteria are movement, place, safety and environment. Current performance is compared with an aspirational state with a 'level of service' score. This gives a knowledge of gaps in performance to inform Module 3 which is about developing options. Victorian examples of what streets and roads that exemplify these options are pictured.  Finally Module 4 includes a method of assessing options. 

For more information download Movement and Place in Victoria from the link given before.


Movement and Place Framework Technical Appendix

This is perhaps of even greater interest as DoT does not publish it on its website. It has only come out because it was tabled through the SRL hearing process. If you want to see it, go to the SRL Inquiry and Advisory Committee page, go to 'Tabled Documents' and select the various dates until you get to document number 380 (it's under 12-18 March). Then download and SAVE. 

Don't let the term 'Technical Appendix' scare you; large parts are understandable to the layperson. Importantly it has specific and measurable assessment standards. This lets you gauge whether something is good or not (or, in their jargon, has an appropriate 'level of service' or not). And it helps communities call out instances of bad design and hold agencies such as the DoT and projects such as the SRL accountable against professionally-developed standards. 

The Appendix contains tangible classifications for the importance and performance 'modules' described above. 

Module 1's classifications are about importance. Both movement and place are on axes from locally significant to state significant. The volume is also important for movement, ranging from local movement to mass movement. This is split up by mode such as walking, cycling, freight, general traffic, public transport and public transport interchange. The latter includes everything from a quiet regional coach stop to a major railway station serving almost the whole state. 

Module 2's classifications are to do with performance. Performance is on an A-E scale (A being the best). Below is an example for walking. Highest level of service coincide with minimal delay while lowest level of service coincides with longer delays. 

In a refreshing burst of frankness, network performance is acknowledged to be 'very poor' for walking. While not stated this is largely due to a combination of road traffic volumes and design choices like wide roads with long turning radii, large roundabouts, long signal cycle times, unresponsive crossings and too few zebra crossings. The good news is that these can be changed. And often cheaply too! 

As well as crossing time there is distance. Especially if people who want to go straight across to their destination are forced to backtrack due to road design or crossing placement. This is recognised below where both delay and distance are considered. 

These are really simple and easy to apply performance measures that can help communities measure walking amenity of their area. It is a mystery why they are buried in a 'technical appendix' normally not published as a matter of course. 

A consequence of ignoring the above in design can give bad outcomes even from recent projects, such as this 2021 level crossing removal example at Chelsea. In this case a pedestrian bridge was built but a poor highway pedestrian crossing placement resulted in a poor level of service for walkers with significant backtracking. In contrast the underpass it replaced was convenient to a crossing with a consequently shorter walking distance. 


The Movement and Place appendix includes similar measures for other transport modes. Here's the one for public transport interchange. 


Other indicators are about public transport speed relative to the speed limit (and for some) traffic speed. Note that (possibly) because of this framework's origin in road planning, only on-road public transport (ie tram and bus) and not trains is considered for the speed criteria. Also matters purely under the control of public transport planners such as operating hours, service frequency and scheduled timetable coordination are not considered. Even though something like a missed connection and a 30 - 60 min wait (common in Melbourne, even on main lines and routes) can have a decisive effect on overall travel time and its volatility for public transport trips. 

Notwithstanding the above limitations, the above classification for interchanges is extremely useful when assessing their design quality. While the Movement and Place framework was not used to assess the two new Melbourne train/bus interchanges in the comparison below, it is clear that the good example (Ormond) would rate highly (either B+ or A-) while the poor example (Mentone) would rate just an E purely on its very long walking time between train and bus. 


The Technical Appendix also includes target minimum performance levels. Given the massive metropolitan scale significance of both the Metro network and SRL rail lines, the requirement for connectivity between them would not be anything but very high (ie LoS A or, if not possible at least B). 

However the risk of much lower levels of service for interchanges apply to the proposed Suburban Rail Loop station designs. This is again due to long interchange times informed by design choices that do not require these be minimised, for instance by providing direct entry between Metro and SRL platforms. 

A recurring theme of my Twitter thread on the SRL hearings has been that councils have strongly advocated for these while those involved in the project, eg DoT and SRLA, have been lukewarm with 'in-principle' or 'nice to have' agreement only. Until we get some firm guarantees on this the community has little confident that it will necessarily get the best or even good outcomes from this aspect of the Suburban Rail Loop's design. 

Environment and Safety are two overarching themes when assessing performance. Safety is given an A rating for everything. Meaning it influences (or is meant to influence) everything else done.   


Conclusion

DoT's Movement and Place framework is an interesting way of thinking about transport priorities and trade-offs. It is really brought to life by the Technical Appendix that has only recently become publicly available, and only then due to a public hearing process. While its traffic planning origin means that it misses certain public transport essentials like service frequency, it is still very useful for assessing things like walkability and interchange design and performance. 

Its impact depends on whether it is recognised and used in the planning of projects, large and small. There's lots of good stuff in it. It needs to be taken seriously and not dispensed with by its sponsoring department as soon as there's the tiniest bit of push-back from a corner-cutting project agency. 

On this the SRL hearings and whether the built design is modified to address the issues such as interchange connectivity will be an interesting test case of the Movement and Place framework's status and resilience. If they aren't going to properly use it in their biggest, best funded and most important rail project then where would it apply?

Comments on Movement and Place are appreciated and can be left below.  

Tuesday, April 05, 2022

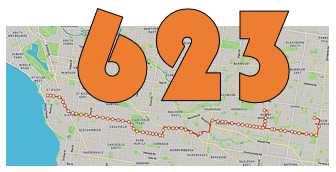
TT #159: St Kilda to Glen Waverley's 623


Extending from St Kilda to Glen Waverley via Chadstone Shopping Centre, Route 623 is a key bus route across Melbourne's south and south-east. While its western half parallels the 67 tram, the 623  more directly serves some major destinations the 67 doesn't including St Kilda and Chadstone Shopping Centre. Much of 623's catchment has undergone densification, particularly around Glen Waverley and Carnegie, and is unrecognisable from 20 years ago. 

The PTV-generated route map is below. Key roads served include Glen Eira Rd in the west and Waverley Rd in the east. The route is mostly fairly simple except for backtracking via Mt Waverley Station. 


The annotated network maps below show the 623 relative to other routes and lines. Key issues and oddities are also highlighted.

While it intersects with the Sandringham line at Ripponlea station, it lacks good Frankston line connectivity. Access to the trains at Glen Huntly requires crossing of Glen Huntly Rd and sometimes Neerim Rd. A new Glenhuntly station is being built as part of grade separation works but, like the existing station, it will have only a single entrance on the south side of Glen Huntly Rd. 

Moving east there is significant overlap with other routes in the Carnegie area. Firstly there is 624 on parts of Neerim Rd. Then there is 900 and a portion of 822 on Dandenong Rd. The 900 is a SmartBus route added in 2006. As was common with the inefficient route-based planning of the time, the 900 was run over the top of existing routes (like parts of the 623 and 624) without full consideration of network benefits that a wider network reform could deliver. 


East of Chadstone the 623 is pretty much straight along Waverley Rd except for a there and back dogleg via Mt Waverley. This is confusing as the same stops serve buses going towards both Glen Waverley and St Kilda. The 623 on Stephensons Rd overlaps the 733 but this is largely a north-south route whereas the 623 is east-west. 733 is much like 623 in that it is a very productive bus route with high ridership despite a 30 - 60 minute frequency at most times.  

Route 623 serves several electorates including Albert Park (Martin Foley Labor), Caulfield (David Southwick Liberal), Oakleigh (Steve Dimopoulos Labor) and Mt Waverley (Matt Fregon Labor). Some boundaries will change for this year's state election. For more information see my 7 part seat by seat 2022 state election special. Route 623 is mentioned here as a prospect for an electorally significant service upgrade. 

Service levels

Route 623 operates at typical frequencies for a Melbourne bus route. Weekday frequency is every 30 minutes (including in peak) while weekend service is every 60 minutes. It has run 7 days until 9pm since Meeting our Transport Challenges 'minimum service' upgrades about 15 years ago. With one or two minor exceptions weekday peak service is also every 30 minutes. 

In the early 1980s Route 623 was a 5 1/2 day route operating about every 30 minutes on weekdays and Saturday mornings. Hourly Saturday afternoon service was added in the late 1980s (around when trading hours were liberalised). Early 1990s cuts saw the Saturday morning service cut to hourly. This is where its timetable sat until the operating hours upgrades more than a decade later which saw hourly service added over more of the day 7 days per week. 

When bus operators were smaller there was a greater tendency to add extra services for local events and late night shopping. This tendency has become less significant as more bus routes gained weekend and early evening trips as part of regular operations. However for some time after it gained service to 9pm Route 623 had extra even later trips put on to get people home from the annual St Kilda Festival.     

Patronage

The average Melbourne bus route picks up just over 20 passengers per live service hour. Route 623 is nearly double that (37 to 41 boardings/hour depending on the day of the week). Usage is quite flat across the whole week with Sundays actually being its most productive day. This characteristic reflects its role as being a major feeder to Chadstone that gets a lot of use despite its hourly weekend frequency. 

Route 623 is an example of a route that is underserviced relative to its patronage. Adding service, especially on weekends, would likely boost patronage further. More on how high productivity can wreck a bus route (or at least have it perform well below potential) is here. It is quite possible that 623's usage and potential network role is so strong that it deserves to be a twenty minuter seven days per week. There may be scope to reduce costs if such upgrades occur in concert with amalgamation with part of Route 624 around Murrumbeena/Carnegie and network reforms around Caulfield as discussed here. 

History

Parts of what is now the 623 can trace its past back to the 1920s. By the early 1950s there was a service from Port Melbourne to Murrumbeena (noting that by then Port Melbourne had become quite industrial, attracting people commuting to jobs by bus). There was a degree of chopping and changing in the 1950s and 1960s but in recent decades the route has been relatively stable. This can be verified by looking at various network maps from 1971. 

For a long time the 623 was just the standard Monday to Saturday daytime affair but 7 day service and hours until 9pm was added about 15 years ago. Despite being hourly the added weekend trips have been massively successful due to the route serving key weekend entertainment and shopping centres including St Kilda, Chadstone and Glen Waverley. 

Route 623's stability and relative simplicity is in contrast with other routes run by Driver Bus Lines (notably 624 & 627) that got chopped, changed and generally made more complicated in the 1980s and 90s. Half the madness ended nearly 12 years ago when the 627 was split to become the simple 625 and 626.  However despite its patronage potential to support the Metro Tunnel and fill a north-south mobility gap in Melbourne's east the complicated, infrequent and unreformed 624 with its alternating deviations reminds us of work still needed to make buses more useful in this densifying area.

Route 623 (along with 612, 624, 625 and 626) transferred to CDC after Driver Bus Lines sold its route bus operations. 

Conclusion 

Route 623 already has high usage but is there scope for it to perform better and be made simpler? Should it be routed via Caulfield Station to feed trains including those serving the Metro Tunnel and later Melbourne Airport? Does it need more trips on a less duplicative alignment to better reflect its potential role as a major route? And is the Mt Waverley backtracking needed especially if 733 is upgraded to become an SRL SmartBus? What do you think? Comments are invited and can be left below. 


Index to other Timetable Tuesday items

Friday, April 01, 2022

EXCLUSIVE: Better Service Finally Coming! What, how and when.


We've just had the federal budget. An election year effort with 'cost of living' a major selling point, it proved disappointing for Victoria relative to other states with regards to infrastructure spending. Then next month we'll have our state budget. That's also pre-election with all eyes on how it will affect November's vote. 

In its first term the Andrews government leased out the Port of Melbourne to fund its 'Big Build' infrastructure projects. These helped its strong showing in the 2018 election as people saw projects coming to fruition all around them. 

The pandemic

Since then we've had a global pandemic, a shift to working from home, greater budgetary pressures and even, for the first time in years, some population decline in Melbourne. That's changed transport patterns. Many large projects were based on growth that didn't materialise, at least not for now. If we knew then what we know now their business cases would be weaker and they could have been deferred without ill effect (as the infrastructure-wary Grattan Institute has argued).  

COVID-19 saw a reduced task for public transport during commuter peak periods. It it is to retain importance then it is going to have to become much more usable for non-CBD and non-peak period trips. This requires a switch to better all-day service as I suggested here. No more then would Melbourne be grossly underusing its transit infrastructure and vehicles with 30 to 60 minute waits at many times people wish to travel. 


Funding challenges

So how do we fund it? There can be some minor redistribution from peak to off-peak but otherwise more drivers and rostered driver hours are needed. Low interest rates and a treasury happier to spend on capital rather than recurring services have made financing difficult. As a result we have lots of expensive capital sitting idle, out of revenue service, for most of the day.

Recent history has shown it's vastly easier to find $10 billion for a major project than (say) $200 million per year for upgraded train and bus services. Even getting small sums like $5 million annually, such as could reform a local government area's bus network, is rare. It's like funding the world's biggest circus tent but sparing only a pittance for a couple of acrobats and not putting on many shows.  


While I won't call anyone a clown, recent public transport policy priorities have not been too far removed from the above circus analogy. This contrasts with Sydney; they too have built infrastructure but their government also implemented substantial frequency upgrades and network reform in the last five years. As an example, gaps between suburban trains now rarely exceed 15 minutes while simplified bus networks have made 10 minute frequencies common all week. That compares with widespread 30 minute train headways and complex overlapping bus routes a decade ago.

Of the recent Victorian state budgets, 2020's most clearly starved service at the expense of infrastructure. 2021's budget, out six months later, was a bit better, moving the dial a couple of notches towards service. 

Since then we've had Victoria's Bus Plan. This said all the right things but was light on detail, being essentially a 'plan for a plan'. We got some sensible overdue low-budget bus upgrades but nothing really game-changing. 

Given high population growth (until very recently) service kilometres need to be greatly boosted if we were even to just restore the per-capita service kilometres we had in 2011. If the 2022 budget doesn't come through with progress here then it's hard to see that later post-election budgets will.


The Better Service Finance Corporation

As we saw with the port sale, the Andrews government has not been averse to doing bold things. With much of its infrastructure program built or nearly so it's time for attention to shift to maximising benefit from it. This requires investment in service. 

The government isn't stupid. They know this too. All that's needed is the means.

With a budget coming up (in an election year no less) the time is right for a creative way to fund the service we need. On this we can be optimistic and I'll tell you why today. 

Moves are afoot to establish a new financial entity to raise the funds required to run better services. Called the Better Service Finance Corporation (BSFC) it would be part owned by industry superannuation funds. These funds will include those popular with RTBU and TWU members. This creates a confluence of interests as more services means more driver jobs in the industry and better security for union members. 

BSFC will do for service what 'Big Build' did for infrastructure. It is understood that the money involved will be about $300 million per year, or, expressed in today's terms, $9 billion over 30 years. That's enough to deliver Sydney-beating service levels across trains, trams and buses for a generation. Our unbeatable combination of infrastructure and service will be unmatched anywhere else in Australia. And it will come with a degree of stability that will bring confidence to business and development decisions based on high quality transit access. 

Where will BSFC get the money and what will it get in return? The BSFC will be backed by substantial A-grade government-backed assets. This will enable low-interest finance to be obtained to deliver 30 years worth of service upgrade.  

This security will be on the back of a deed agreement that passes ownership of the Suburban Rail Loop to the BSFC in 2052. After then the government will pay BSFC an 'availability payment' for the infrastructure and an operating fee to it as the franchisee. The margin on this will enable the BSFC to repay what it borrowed to fund the $300 million annual to pay for better services and provide returns for superannuants as a stable utility-type investment. As well BSFC has negotiated land purchase options on strategic developable sites near proposed SRL stations to further strengthen returns.


Not being a government-owned entity, BSFC finances will be 'off-book'. Government accounting in the 30 years leading up to 2052 will treat this as income to offset spending on the proposed major service uplift. This will allay Treasury concerns and overcome the main impediment we've had to funding high quality turn-up-and-go public transport across Melbourne.  

We've waited a long time for this. It's great that it's finally coming. BSFC promises to be a game-changer in how we fund, run and use the network. No longer will service play second fiddle to infrastructure. No more waiting 40 minutes for a train or buses that don't run on Sundays. 

Hundreds of thousands more jobs will finally have good transport access when people need it, delivering affordable driving alternatives not a moment too soon. Best of all is that the upgrades will flow from 2023, making them a key plank in the government's re-election bid. After all, Better Service Fixes Cities.  

A side-letter formally bringing the BSFC into being and enacting its financial instruments will be signed by Treasurer Pallas by noon today according to a well-placed source. In the meantime enjoy this taste of what it could deliver, starting next year.